
NacTrack Guide
Introduction
NacTrack is a comprehensive network inventory and configuration management platform designed to help network administrators and engineers manage their network infrastructure effectively. The platform provides:- Real-time device inventory with automatic discovery and tracking
- Network topology visualization (CDP, LLDP, BGP, ISIS)
- IP address management (IPAM) for IPv4 and IPv6
- Configuration compliance monitoring and auditing
- L2VPN and MPLS service tracking
- Integrated troubleshooting tools (traceroute, IP finder)
- Support ticket management with Mantis integration
- Multi-tenant support for MSPs and large enterprises
This guide will help you navigate and use NacTrack's features effectively.
Getting Started
Logging In
- Navigate to your NacTrack instance URL (e.g.,
https://nactrack.example.com) - Enter your username and password
- Click Login
If you've forgotten your password, click Forgot Password and follow the reset instructions.
First-Time Login
After your first login, you may be prompted to:
- Verify your email address
- Change your default password
- Select a client tenant (if multi-tenancy is enabled)
User Interface Overview
The NacTrack interface consists of:
- Top Navigation Bar: Quick access to main sections (Dashboard, Devices, Neighbors, IP Management, etc.)
- User Menu (top right): Account settings, client switching, logout
- Main Content Area: Displays the current page content
- Sidebar (context-dependent): Filters, actions, and additional information
Dashboard Overview
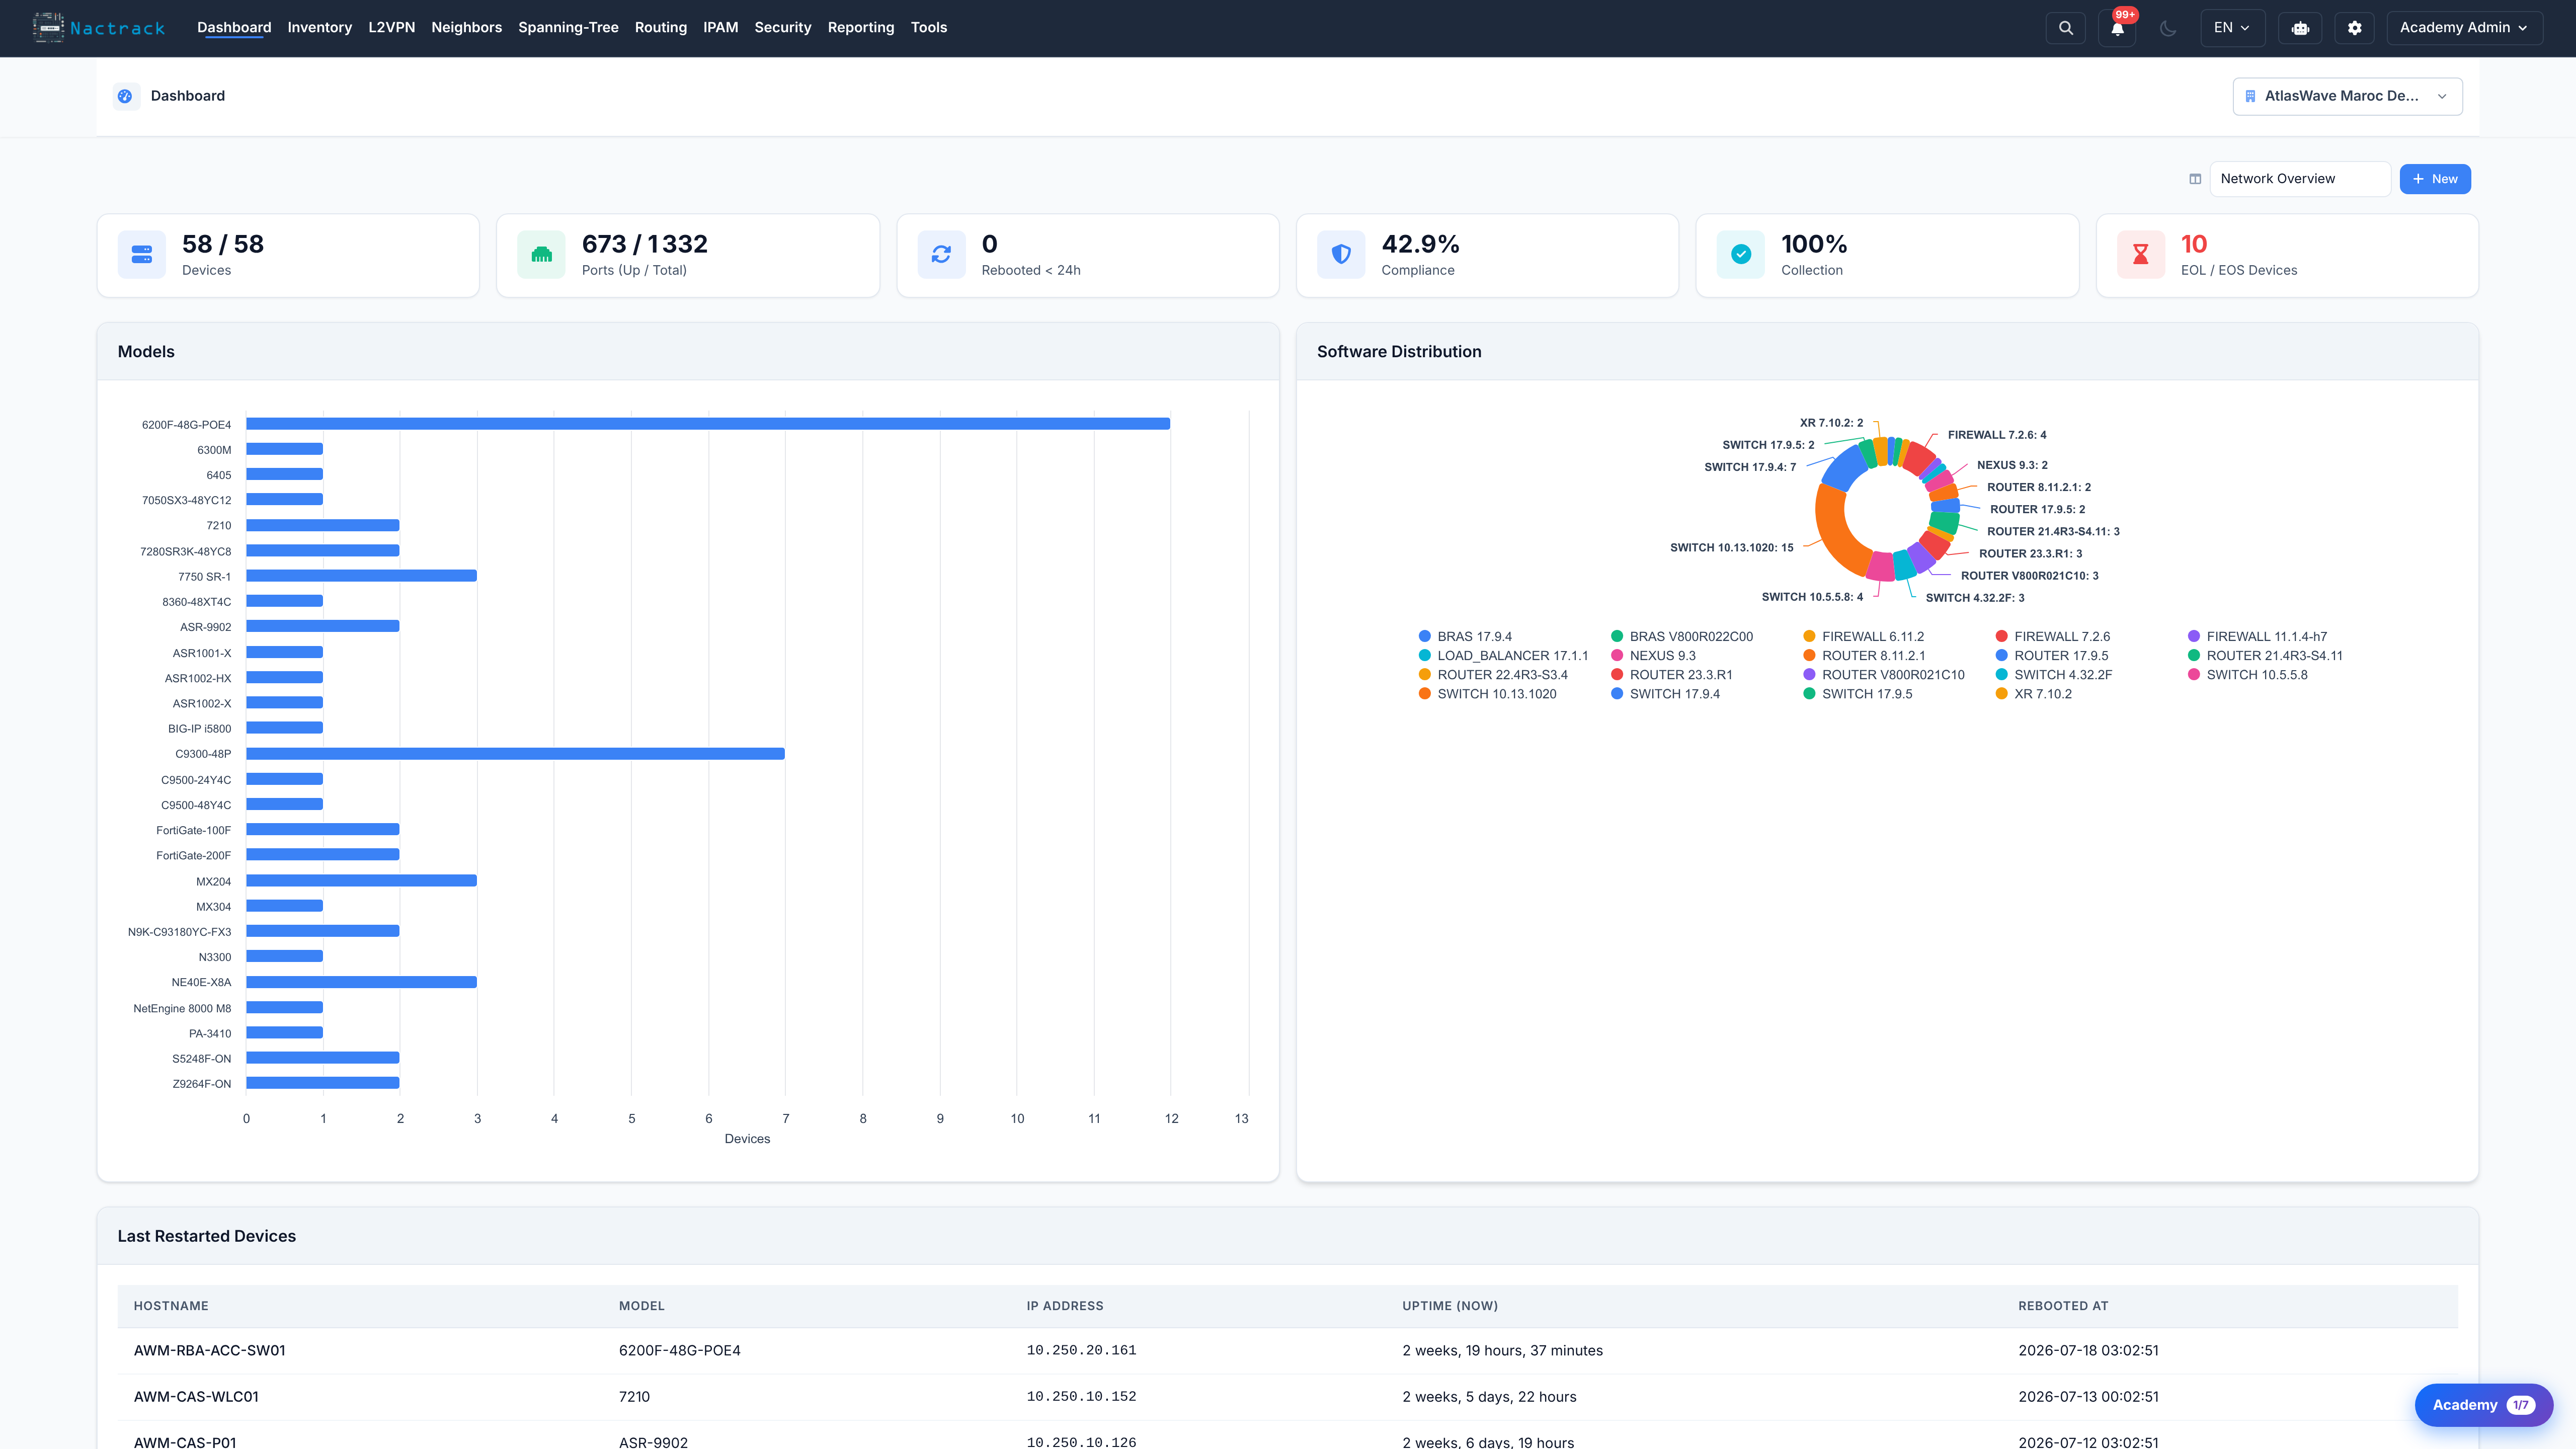
The Dashboard provides a high-level overview of your network infrastructure.
Key Metrics
- Total Devices: Number of managed network devices
- Active Ports: Number of operational interfaces
- Inactive Ports: Number of down interfaces
- Recent Snapshots: Latest device configuration collections
Charts & Visualizations
- Device Distribution by Model: Pie chart showing device types
- Device Distribution by OS: Operating system breakdown
- Recent Reboots: Devices that recently restarted
- Port Status Trends: Historical port up/down statistics
Quick Actions
- Collect All Devices: Trigger a full network snapshot collection
- View Compliance Status: Jump to compliance dashboard
- Open Support Tickets: View active support tickets
Device Inventory
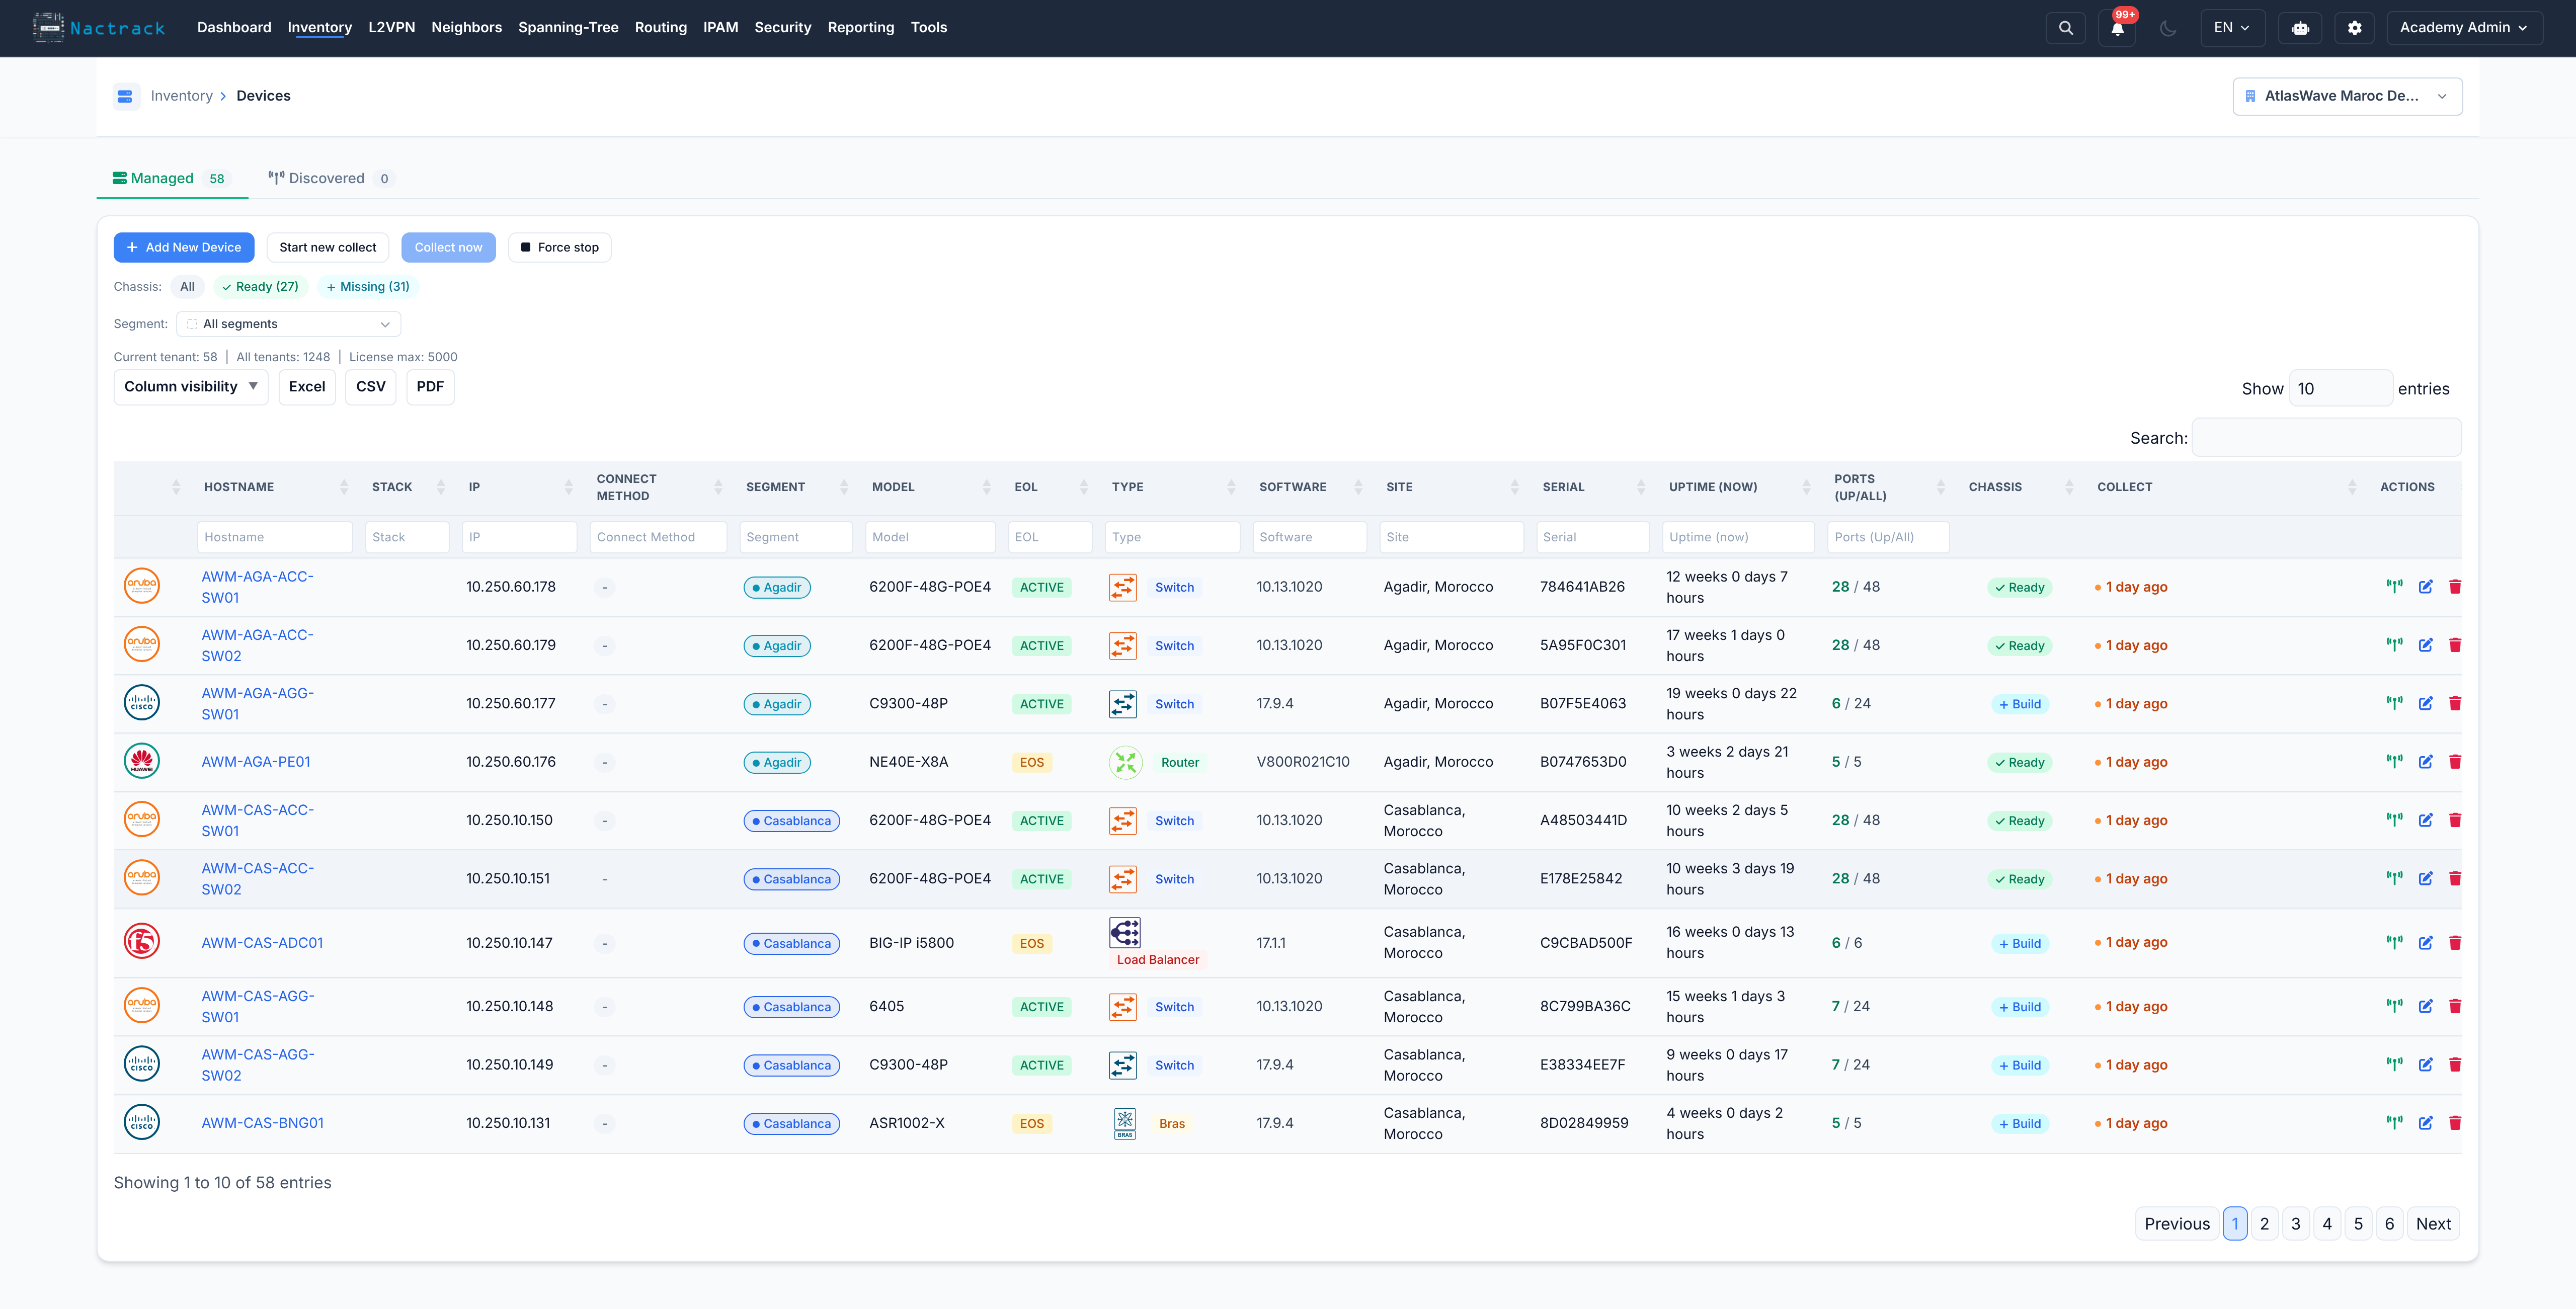
The Devices section provides comprehensive inventory management.
Viewing Devices
Navigate to Devices → Inventory to view all managed devices.
Columns Include:- Hostname: Device name
- IP Address: Management IP
- Model: Hardware model (e.g., Catalyst 2960X, ASR 9000)
- OS Version: Software version
- Status: Up/Down status
- Uptime: Time since last reboot
- Serial Number: Hardware serial
- Location: Physical location (if configured)
Searching & Filtering
Use the search bar to find devices by:
- Hostname
- IP address
- Model
- Serial number
- Location
- Device Type (Router, Switch, Firewall)
- Status (Up, Down, Unknown)
- Client/Tenant
- OS Type (IOS, IOS-XE, IOS-XR, NX-OS, Huawei VRP)
Device Details
Click on a device hostname to view detailed information:
Overview Tab
- Device specifications (model, serial, OS)
- Management information (IP, credentials status)
- Uptime and last collection timestamp
- Device role (BRAS, Internet Edge, Core, etc.)
Ports/Interfaces Tab
View all physical and logical interfaces:
- Interface Name: Port identifier (e.g., GigabitEthernet0/1)
- Status: up/down/admin-down
- Speed/Duplex: Link characteristics
- VLAN: Assigned VLAN(s)
- Description: Port description
- IP Address: Assigned IPv4/IPv6
- MAC Address: Interface hardware address
- Media Type: SFP/Cable type
- Neighbor: Connected device (from CDP/LLDP)
- Filter by status (up/down)
- Search by interface name or description
- Export to Excel
Configuration Tab
- Running Configuration: Current active config
- Startup Configuration: Boot configuration
- Configuration Diff: Compare with previous snapshots
- Download: Export configuration as text file
Chassis View Tab (Beta)
Visual representation of the physical device:
- Module and card layout
- Port positions
- Power supply status
- Fan tray status
Device Actions
From the device list or detail page:
- Collect Snapshot: Trigger immediate data collection
- Run Compliance: Evaluate against compliance policies
- View Topology: Show device in network graph
- Edit Details: Update device metadata
- Delete: Remove from inventory (admin only)
Network Discovery
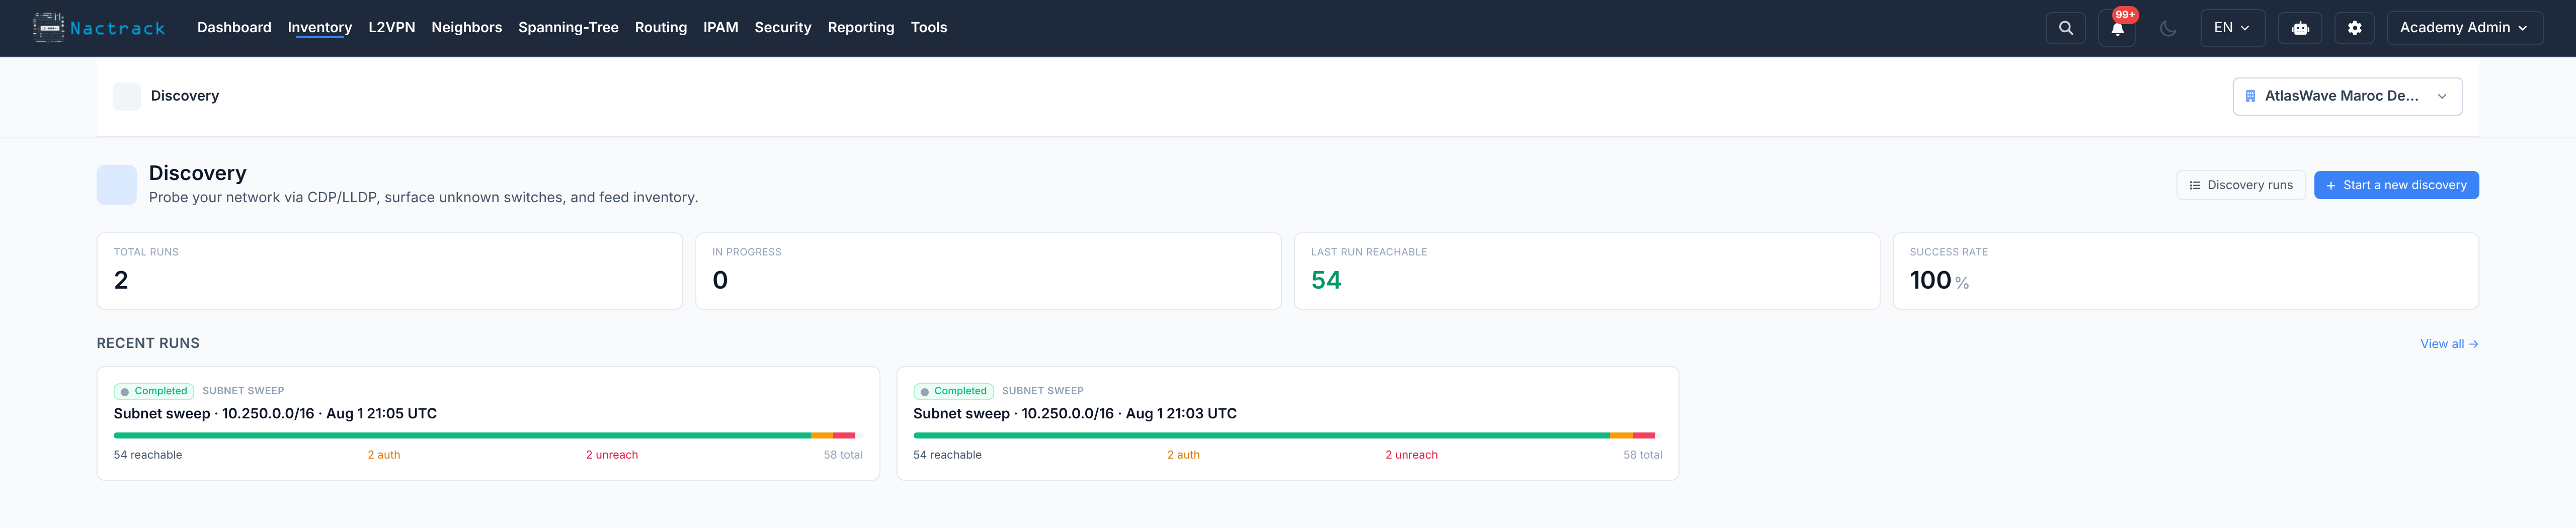
Discovery is how devices get into the inventory in the first place. You give NacTrack a seed - a subnet, an address range or a single device - and it sweeps it, opens a session to whatever answers, reads the device and files what it finds.
Running a sweep
Navigate to Discovery. Choose the seed, pick the credential vaults to try, and start the run. Each run is listed with the time it started, the seed it used and a summary of what it reached.
Reading the result
The counts on a run are the point of the page, and the failures matter more than the successes:
- Reachable - a session was opened and the device was read. These become inventory entries, or update the entry that already exists.
- Authentication failed - the host answered but refused every credential in the selected vaults. The device is there; the vault is wrong or incomplete.
- Unreachable - nothing answered before the timeout. Either there is no device at that address, or a filter is in the way.
- Unrecognized vendor - a session opened but the output did not match any supported platform. Worth reporting, since it usually means a parser gap.
The distinction between the last three is what tells you where to look. An unreachable address is a network or firewall question; an authentication failure is a credential question; an unrecognized vendor is a NacTrack question.
Re-running
Re-running a sweep over the same seed is safe and is the normal way to pick up newly racked equipment. Devices already in the inventory are matched and updated rather than duplicated.
Network Topology
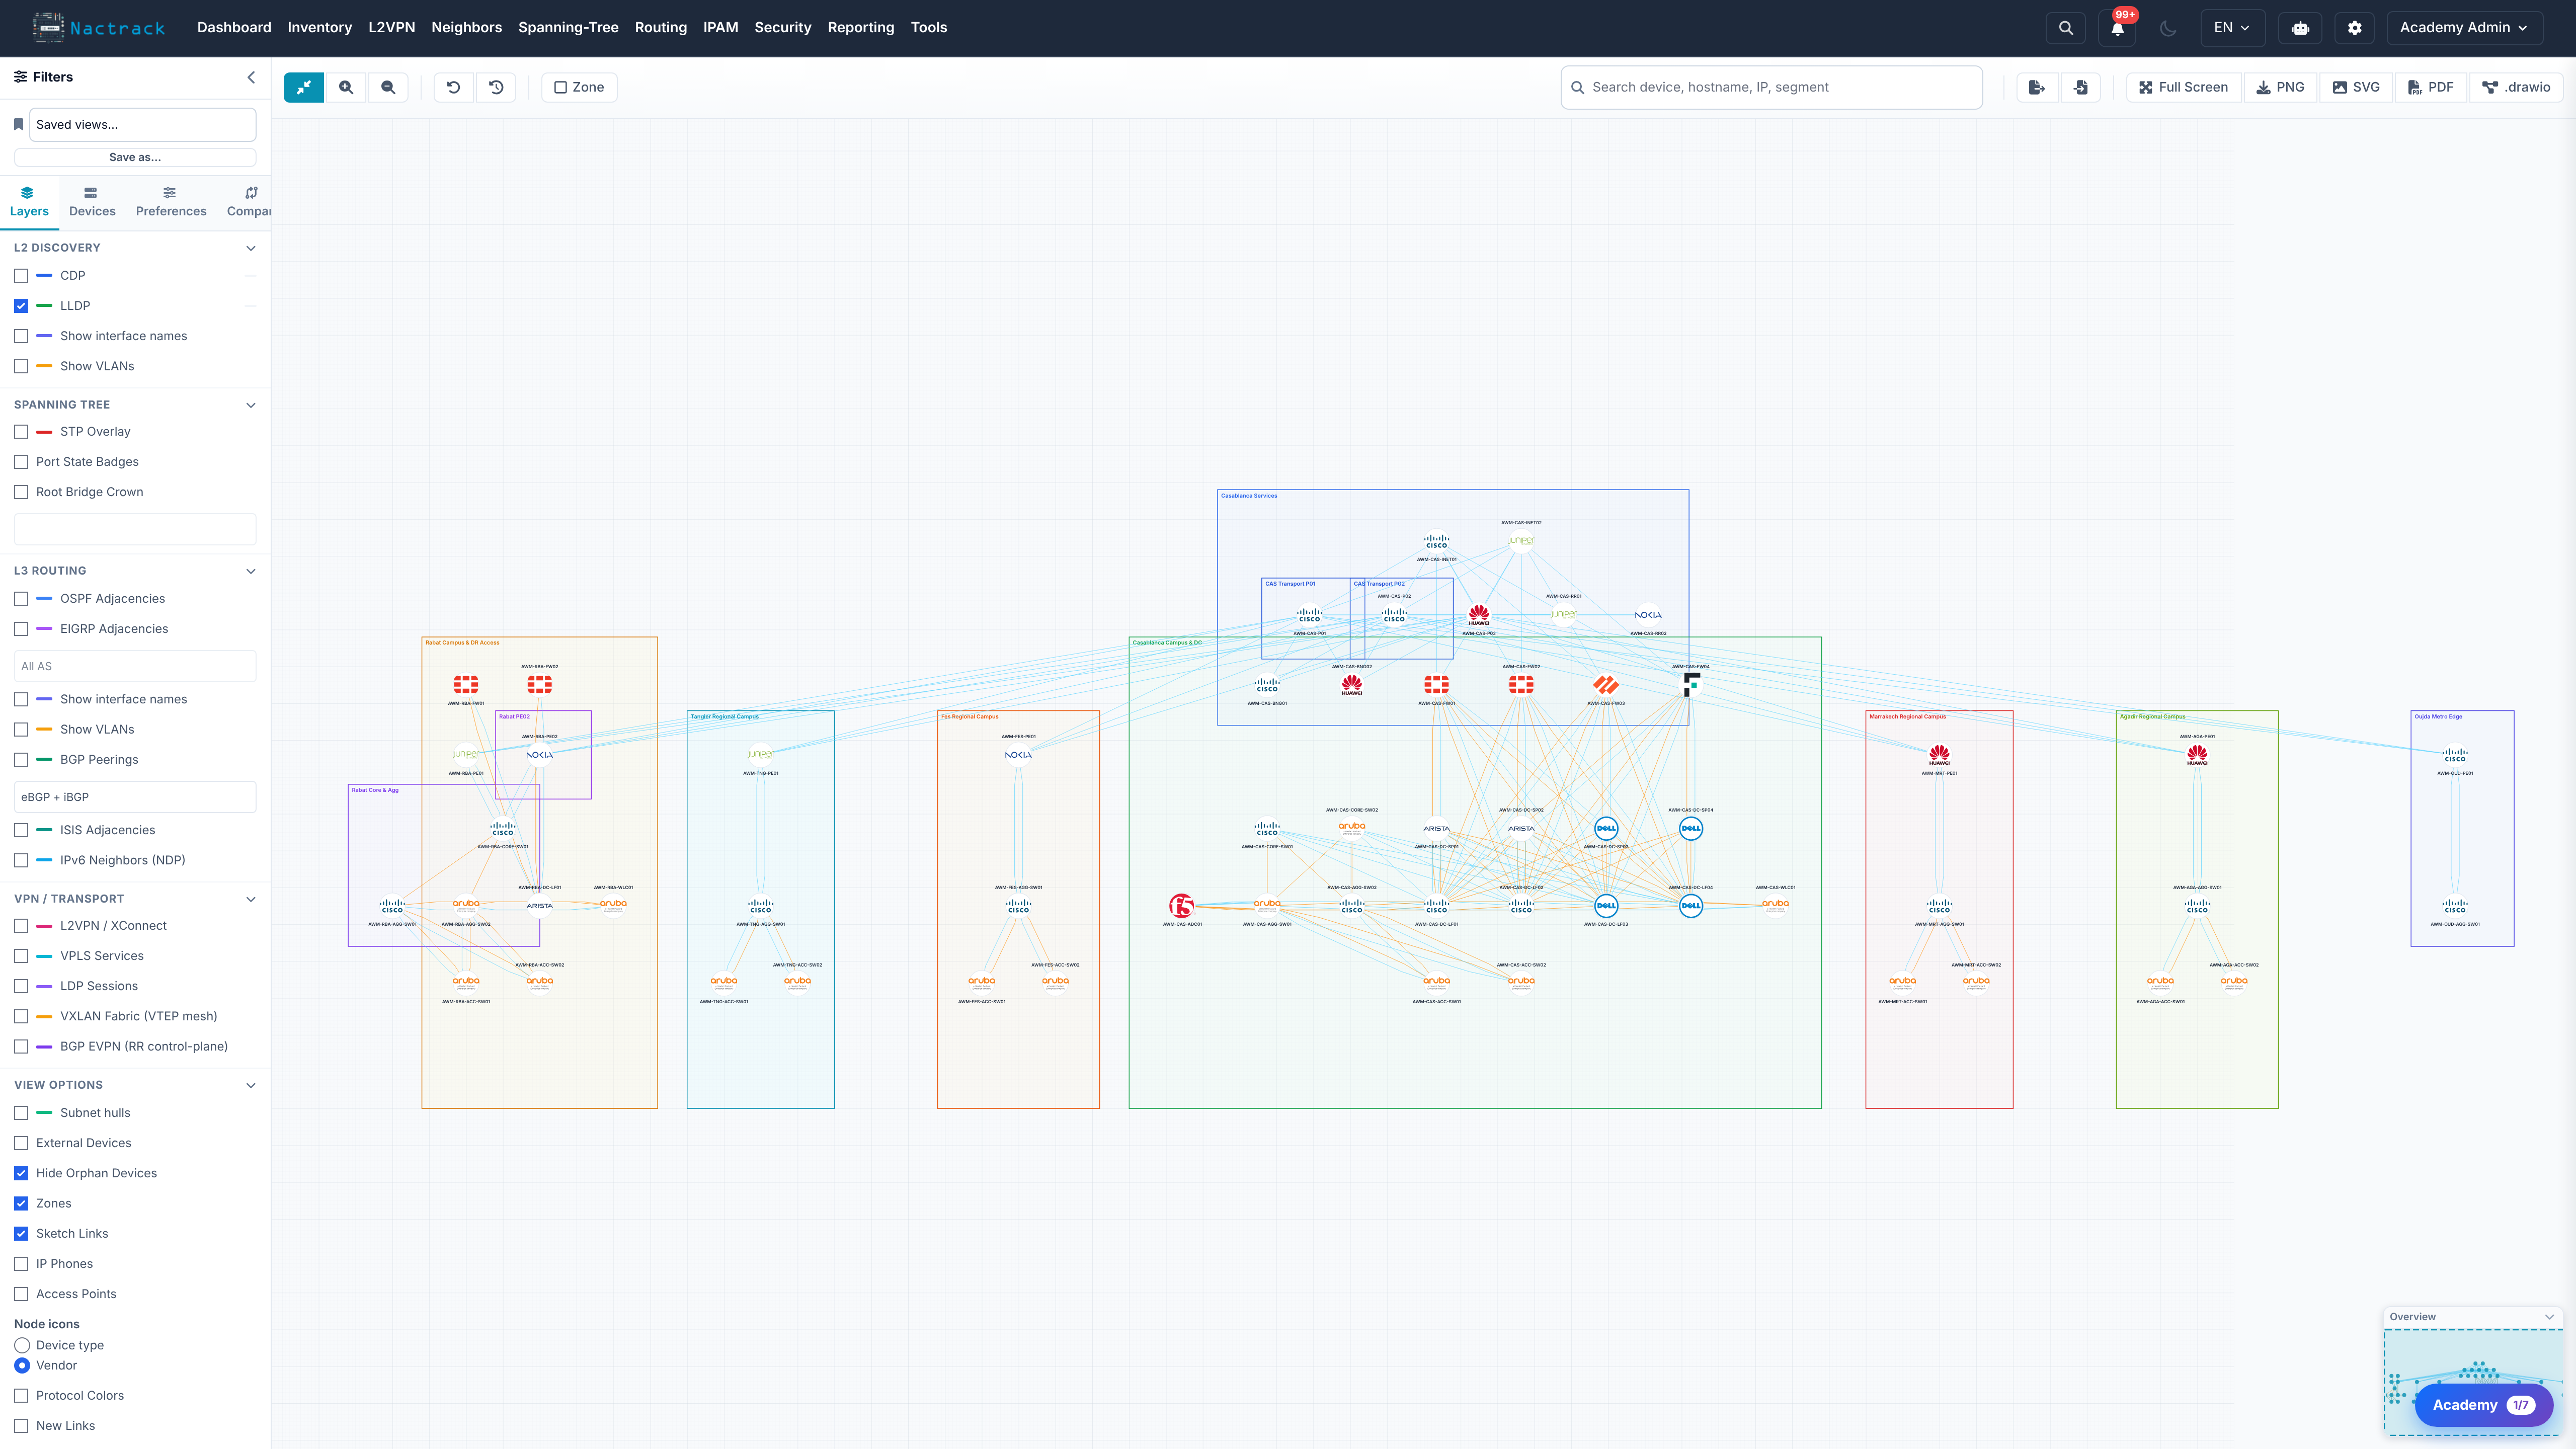
Visualize your network connections and relationships.
Interactive Topology Map
Navigate to Devices → Interactive Topology for a full network view.
Features:- Drag-and-drop node positioning
- Zoom in/out with mouse wheel
- Pan by clicking and dragging background
- Save custom layouts (positions persist)
- Filter by device type or location
- Hover over a node to see device details
- Click a node to jump to device details
- Color-coded by device type or status
- Blue Lines: CDP connections
- Green Lines: LLDP connections
- Red Lines: Down or failed connections
Topology Layouts
Choose from multiple automatic layout algorithms:
- Force-Directed: Physics-based spacing
- Hierarchical: Top-down tree structure
- Circular: Devices arranged in a circle
- Grid: Organized grid pattern
After selecting a layout, you can manually adjust positions and save.
Device-Specific Topology
View topology for a single device:
- Go to Devices → Select a device
- Click View Topology button
- See immediate neighbors and their connections
IP Address Management (IPAM)
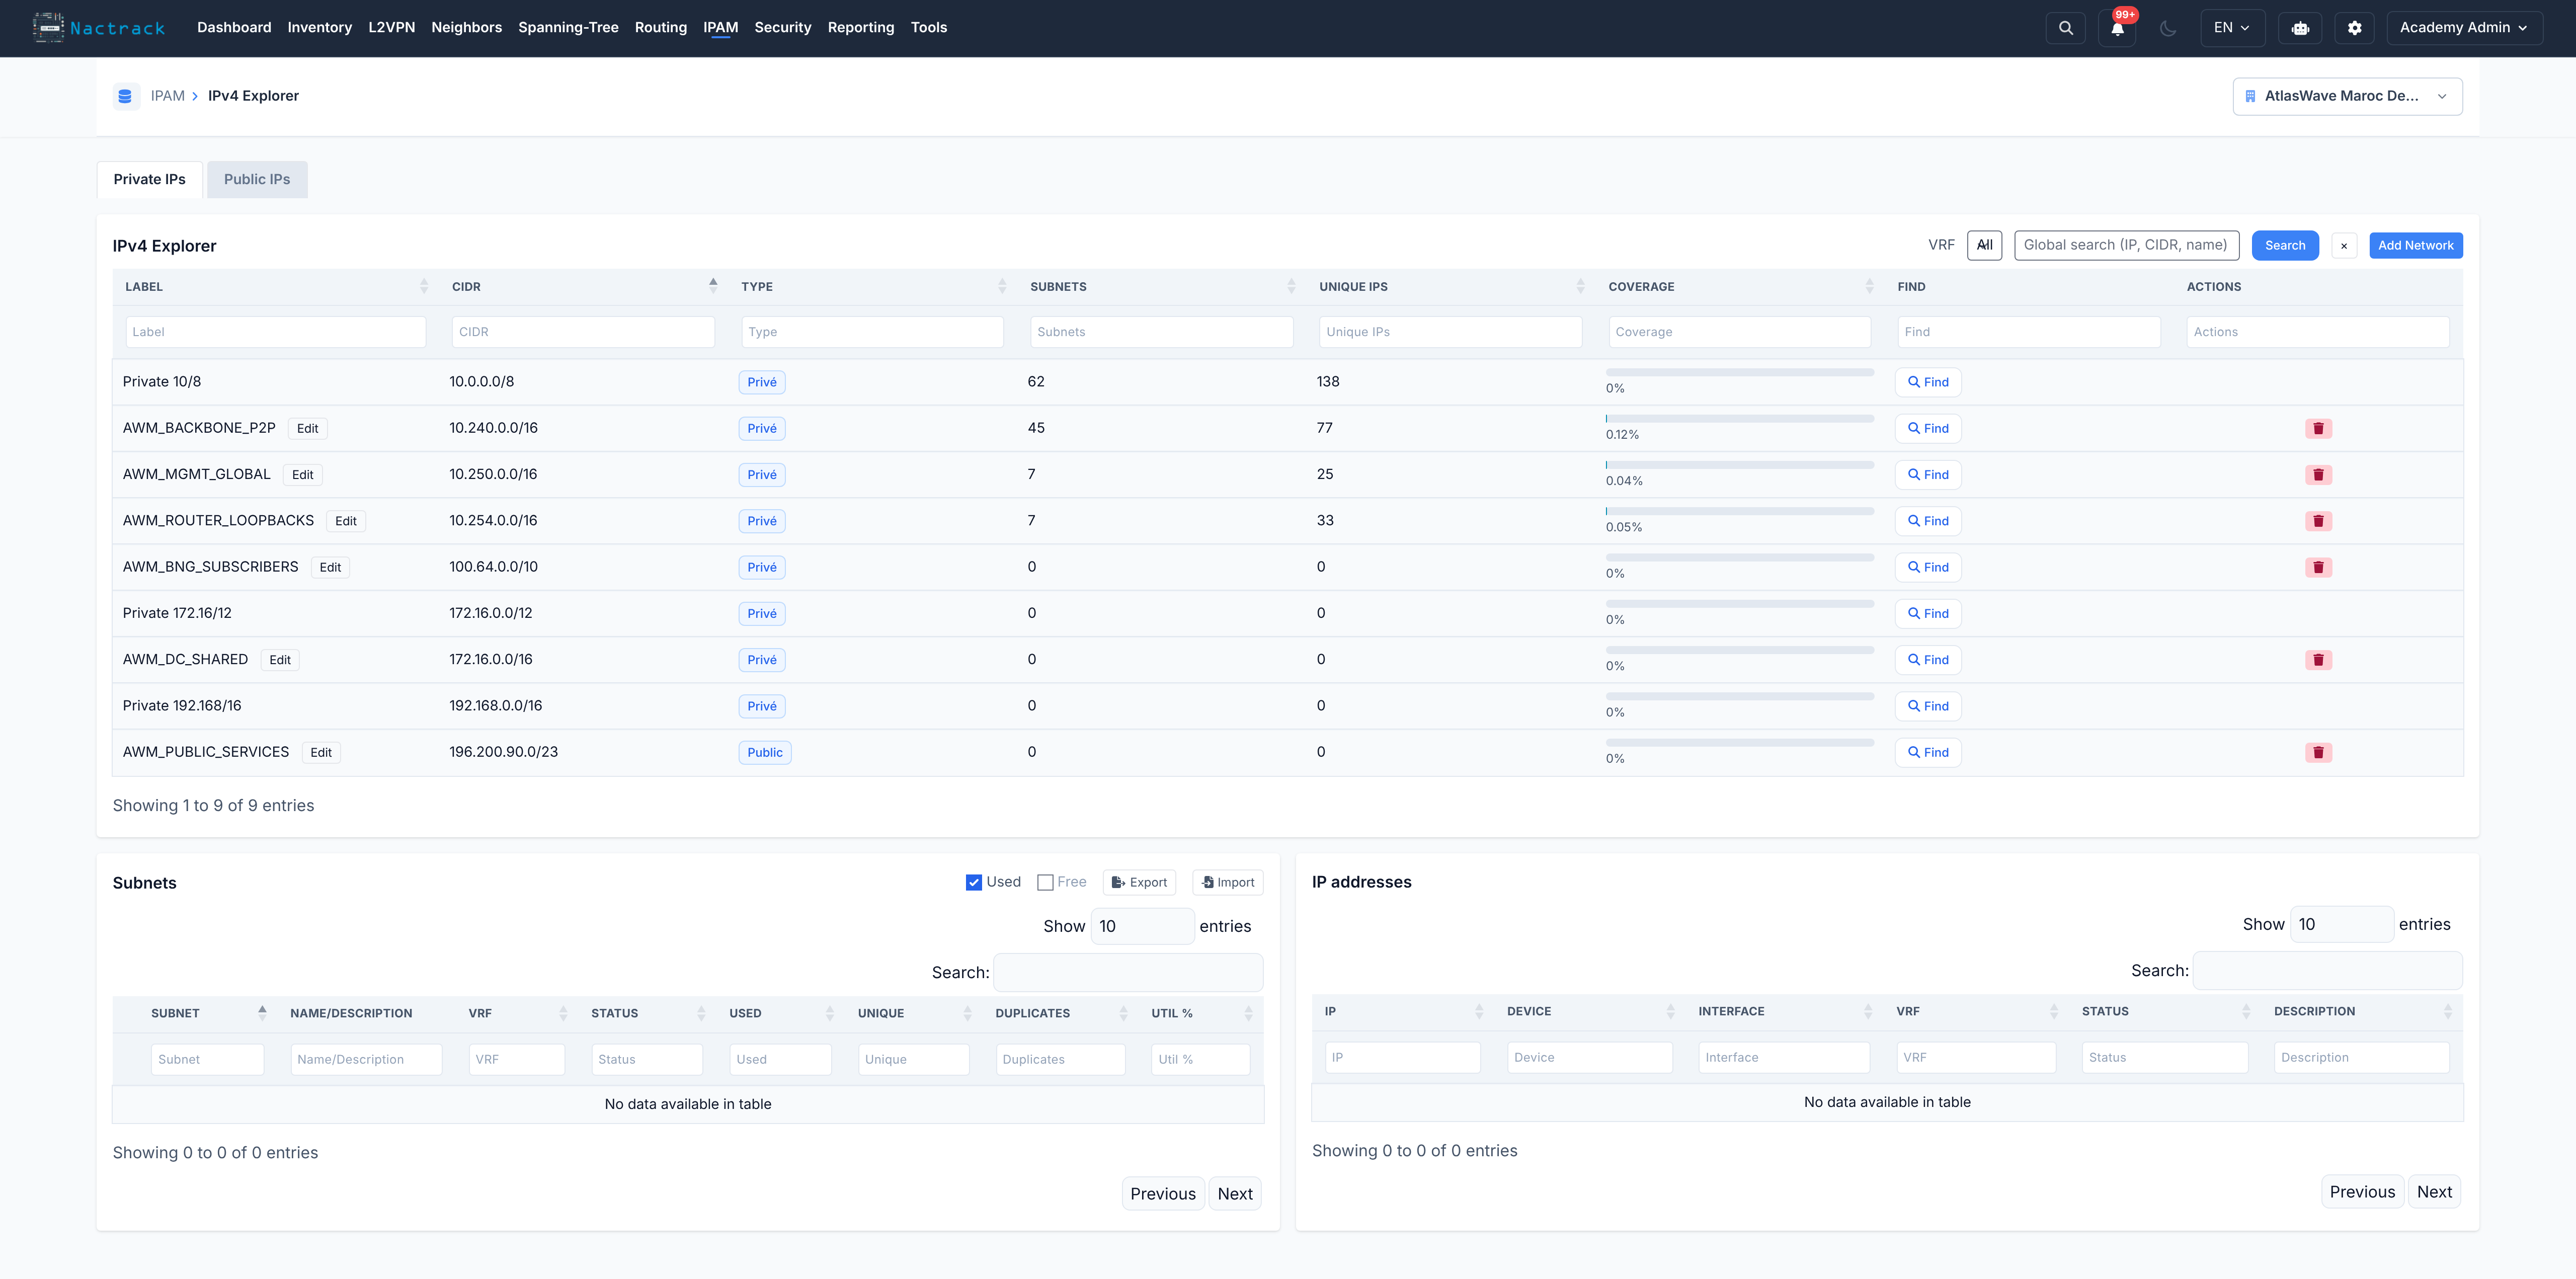
Manage IP address allocations across your network.
IPAM Dashboard
Navigate to IP Management → Dashboard
Key Sections:- IP Statistics: Total IPs, used IPs, available IPs
- Subnet Summary: CIDR blocks and utilization
- Recent Allocations: Latest IP assignments
- Top Consumers: Devices with most IPs
Subnets
View and manage IP subnets:
Subnet List:- Network: CIDR notation (e.g., 10.0.1.0/24)
- VRF: Virtual routing instance
- Total IPs: Address count in subnet
- Used IPs: Allocated addresses
- Available IPs: Free addresses
- Utilization %: Usage percentage
- View Details: See all IPs in subnet
- Add Subnet: Create new subnet tracking
- Export: Download subnet data
IP Address Search
Find IP address information:
- Navigate to IP Management → IP Search
- Enter IP address or range
- View results:
- Device assignment
- Interface assignment
- VLAN association
- VRF membership
- Last seen timestamp
IPv4 Explorer
Browse all IPv4 addresses:
- Filter by subnet: Select specific network ranges
- Filter by status: Assigned, unassigned, reserved
- Filter by VRF: Limit to routing instance
- Search: Find specific IPs or patterns
IPv6 Explorer
Manage IPv6 address space:
- IPv6 Subnets: View all IPv6 networks
- Address Assignments: See assigned addresses
- Gap Analysis: Identify unused address ranges
- Duplicate Detection: Find conflicting assignments
DHCP Pools (BRAS Devices)
For BRAS and access aggregation devices:
- Pool Configuration: View DHCP scope definitions
- Active Bindings: Current IP leases
- Pool Utilization: Free vs. allocated addresses
- Lease History: Track IP assignments over time
Network Overlaps
Detect and resolve subnet conflicts:
- Overlap Detection: Find overlapping CIDR blocks
- Conflict Resolution: Suggested remediation
- VRF Isolation: Separate overlaps by VRF context
Neighbor Discovery
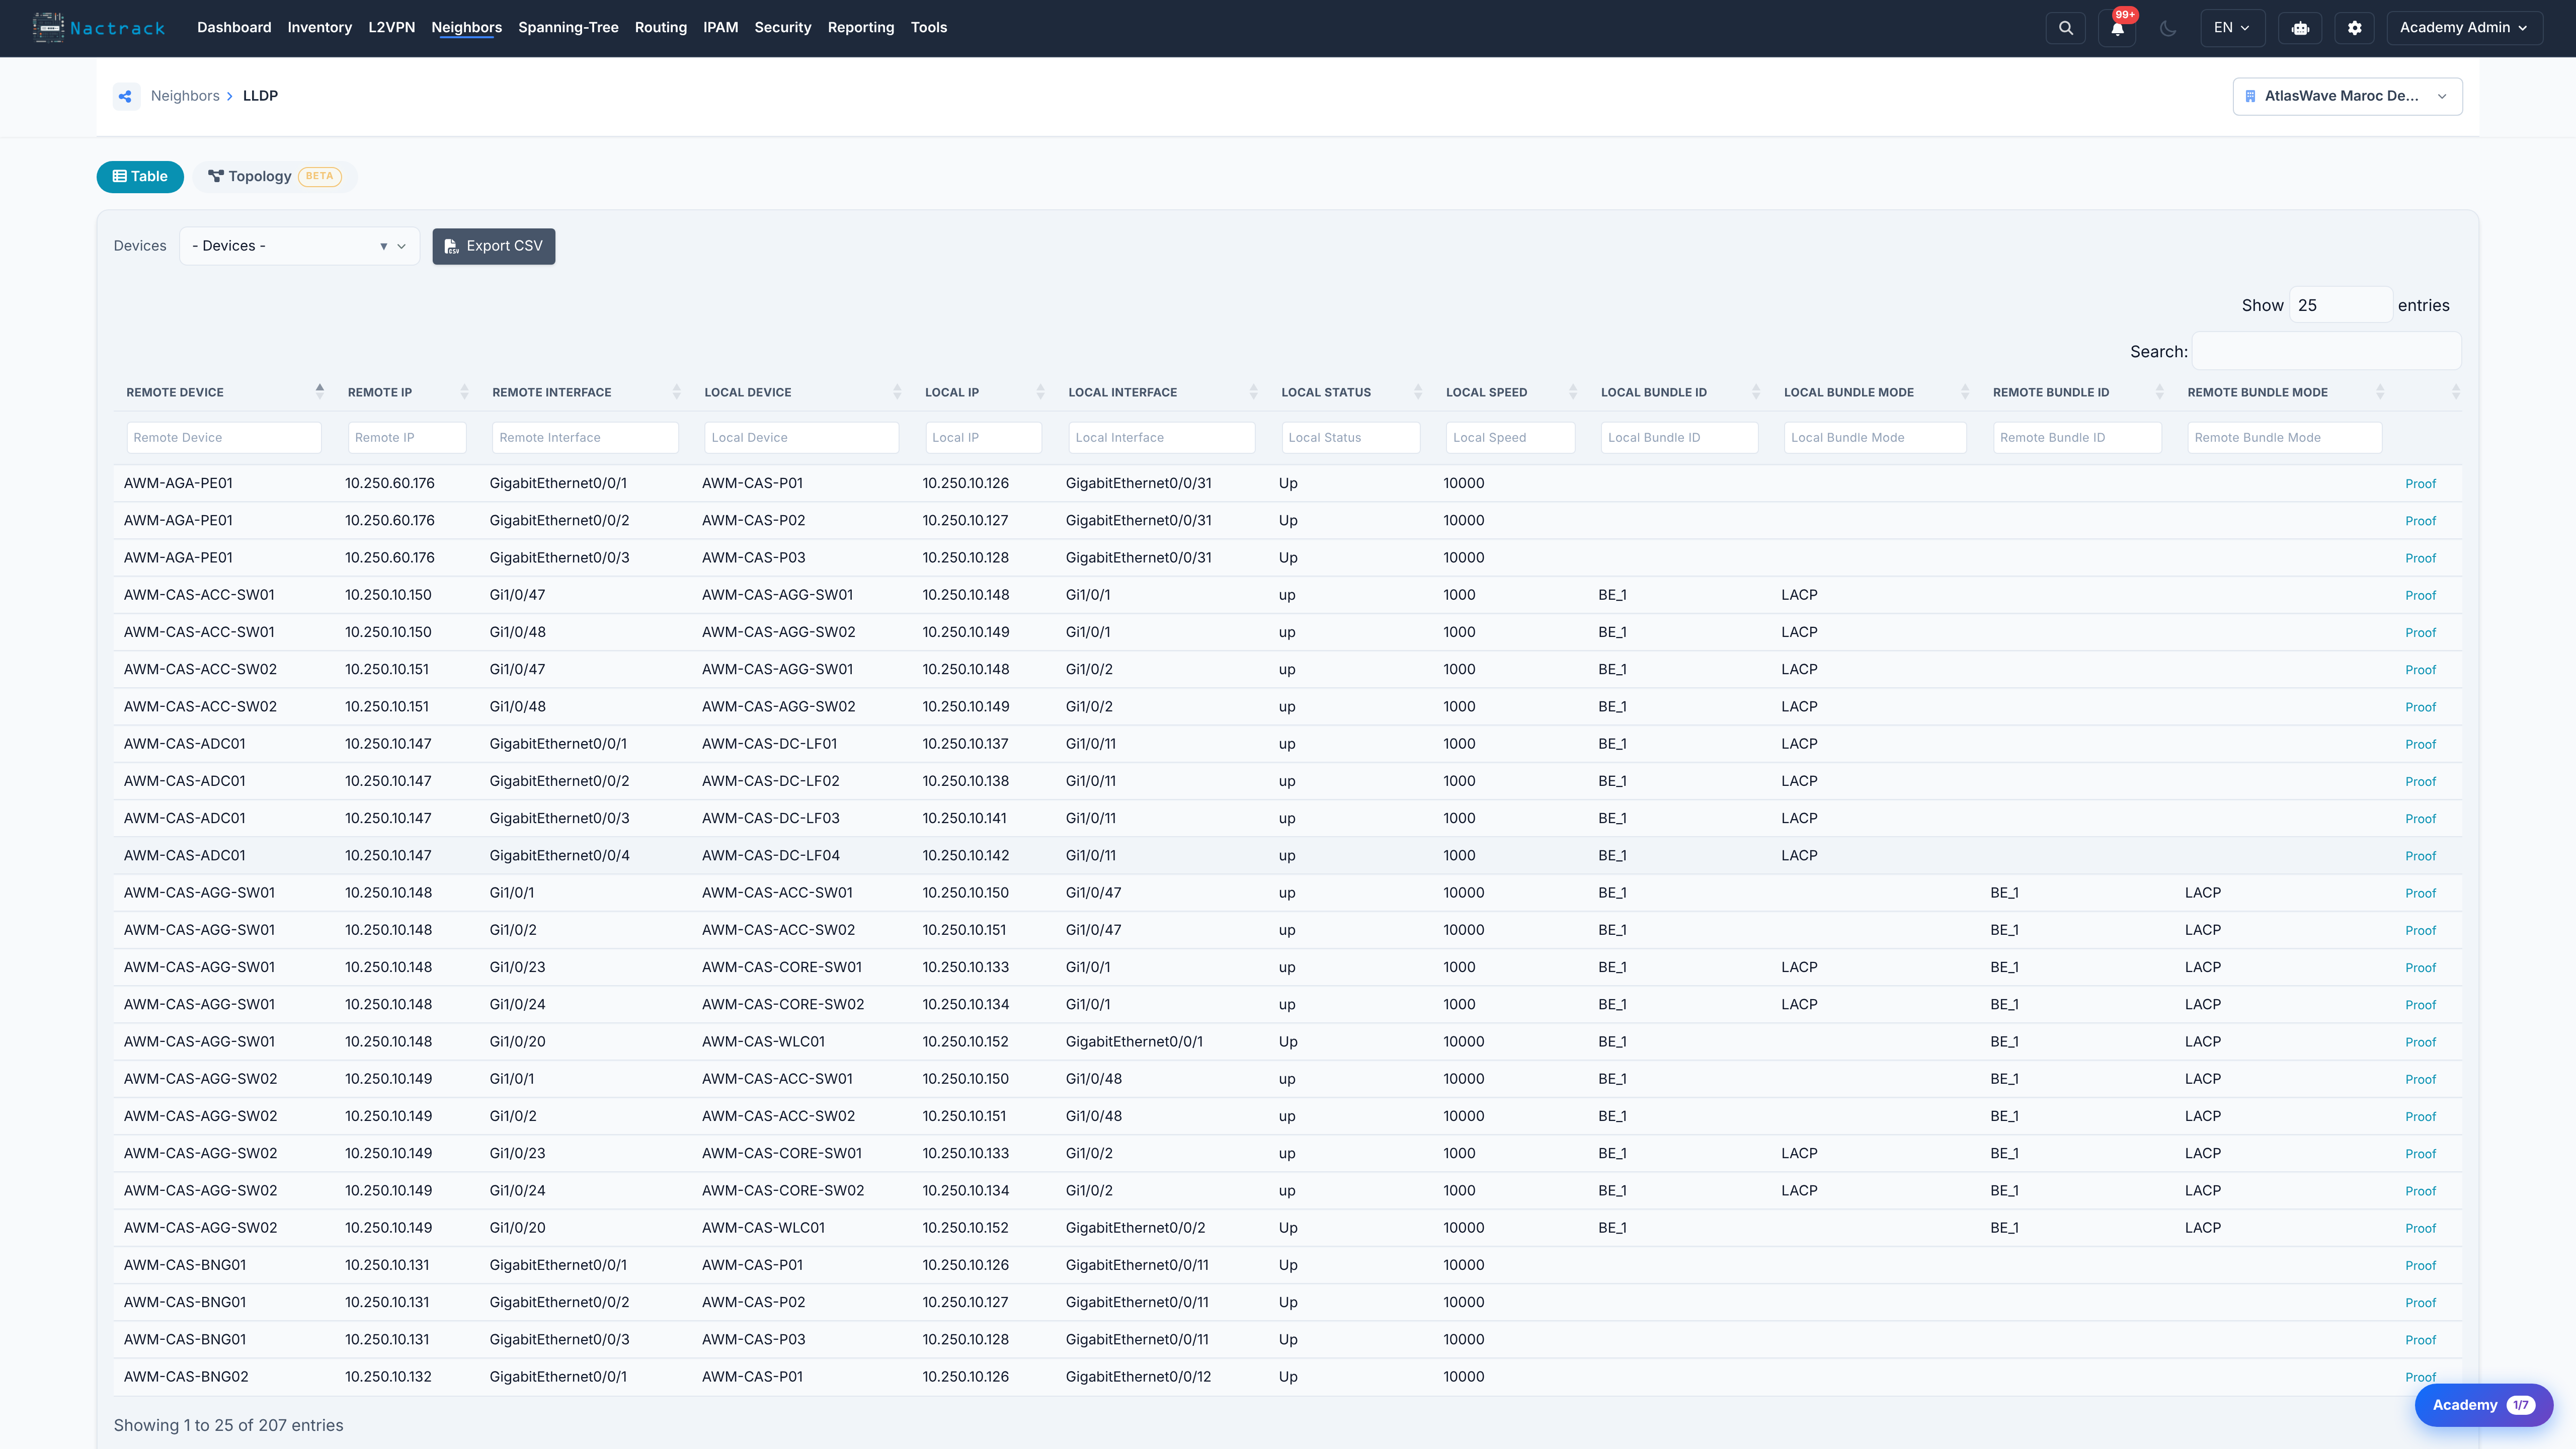
Understand device connectivity through neighbor protocols.
CDP Neighbors
View Cisco Discovery Protocol connections:
Navigate to Neighbors → CDP
Information Displayed:- Local Device: Your managed device
- Local Interface: Outgoing interface
- Remote Device: Neighbor hostname
- Remote Interface: Neighbor's interface
- Platform: Neighbor device model
- Capabilities: Router, Switch, etc.
- Search by device name
- Filter by interface
- Group by chassis
LLDP Neighbors
View Link Layer Discovery Protocol connections:
Navigate to Neighbors → LLDP
Similar to CDP but supports multi-vendor environments:
- System Name: Neighbor device name
- System Description: Device type and OS
- Port Description: Neighbor port info
- Management Address: Neighbor's management IP
BGP Neighbors
View Border Gateway Protocol peer relationships:
Navigate to Neighbors → BGP
BGP Summary:- Neighbor IP: BGP peer address
- AS Number: Autonomous System
- State: Established, Idle, Active, etc.
- Uptime: How long peering has been up
- Prefixes Received: Route count from peer
- Prefixes Sent: Routes advertised to peer
- Visual graph of BGP peering relationships
- AS-level topology view
- Color-coded peer states
- Filter by AS number
- Advertised Routes: See routes sent to upstream providers
- Route Policies: View applied route maps
- Next-Hop Analysis: Track routing path changes
ISIS Neighbors
View Intermediate System to Intermediate System routing neighbors:
Navigate to Neighbors → ISIS
ISIS Database:- System ID: ISIS router identifier
- Hostname: Device name
- Area: ISIS area membership
- State: Up/Down
- Interface: Connection interface
- Metric: Link cost
MPLS LDP Neighbors
View Label Distribution Protocol peers:
Navigate to Neighbors → MPLS LDP
LDP Peer Information:- Peer ID: LDP router ID
- State: Operational, Down
- Uptime: Session duration
- Local Interface: Outgoing interface
- Remote Interface: Peer interface
- Labels: Label binding count
Routing Information
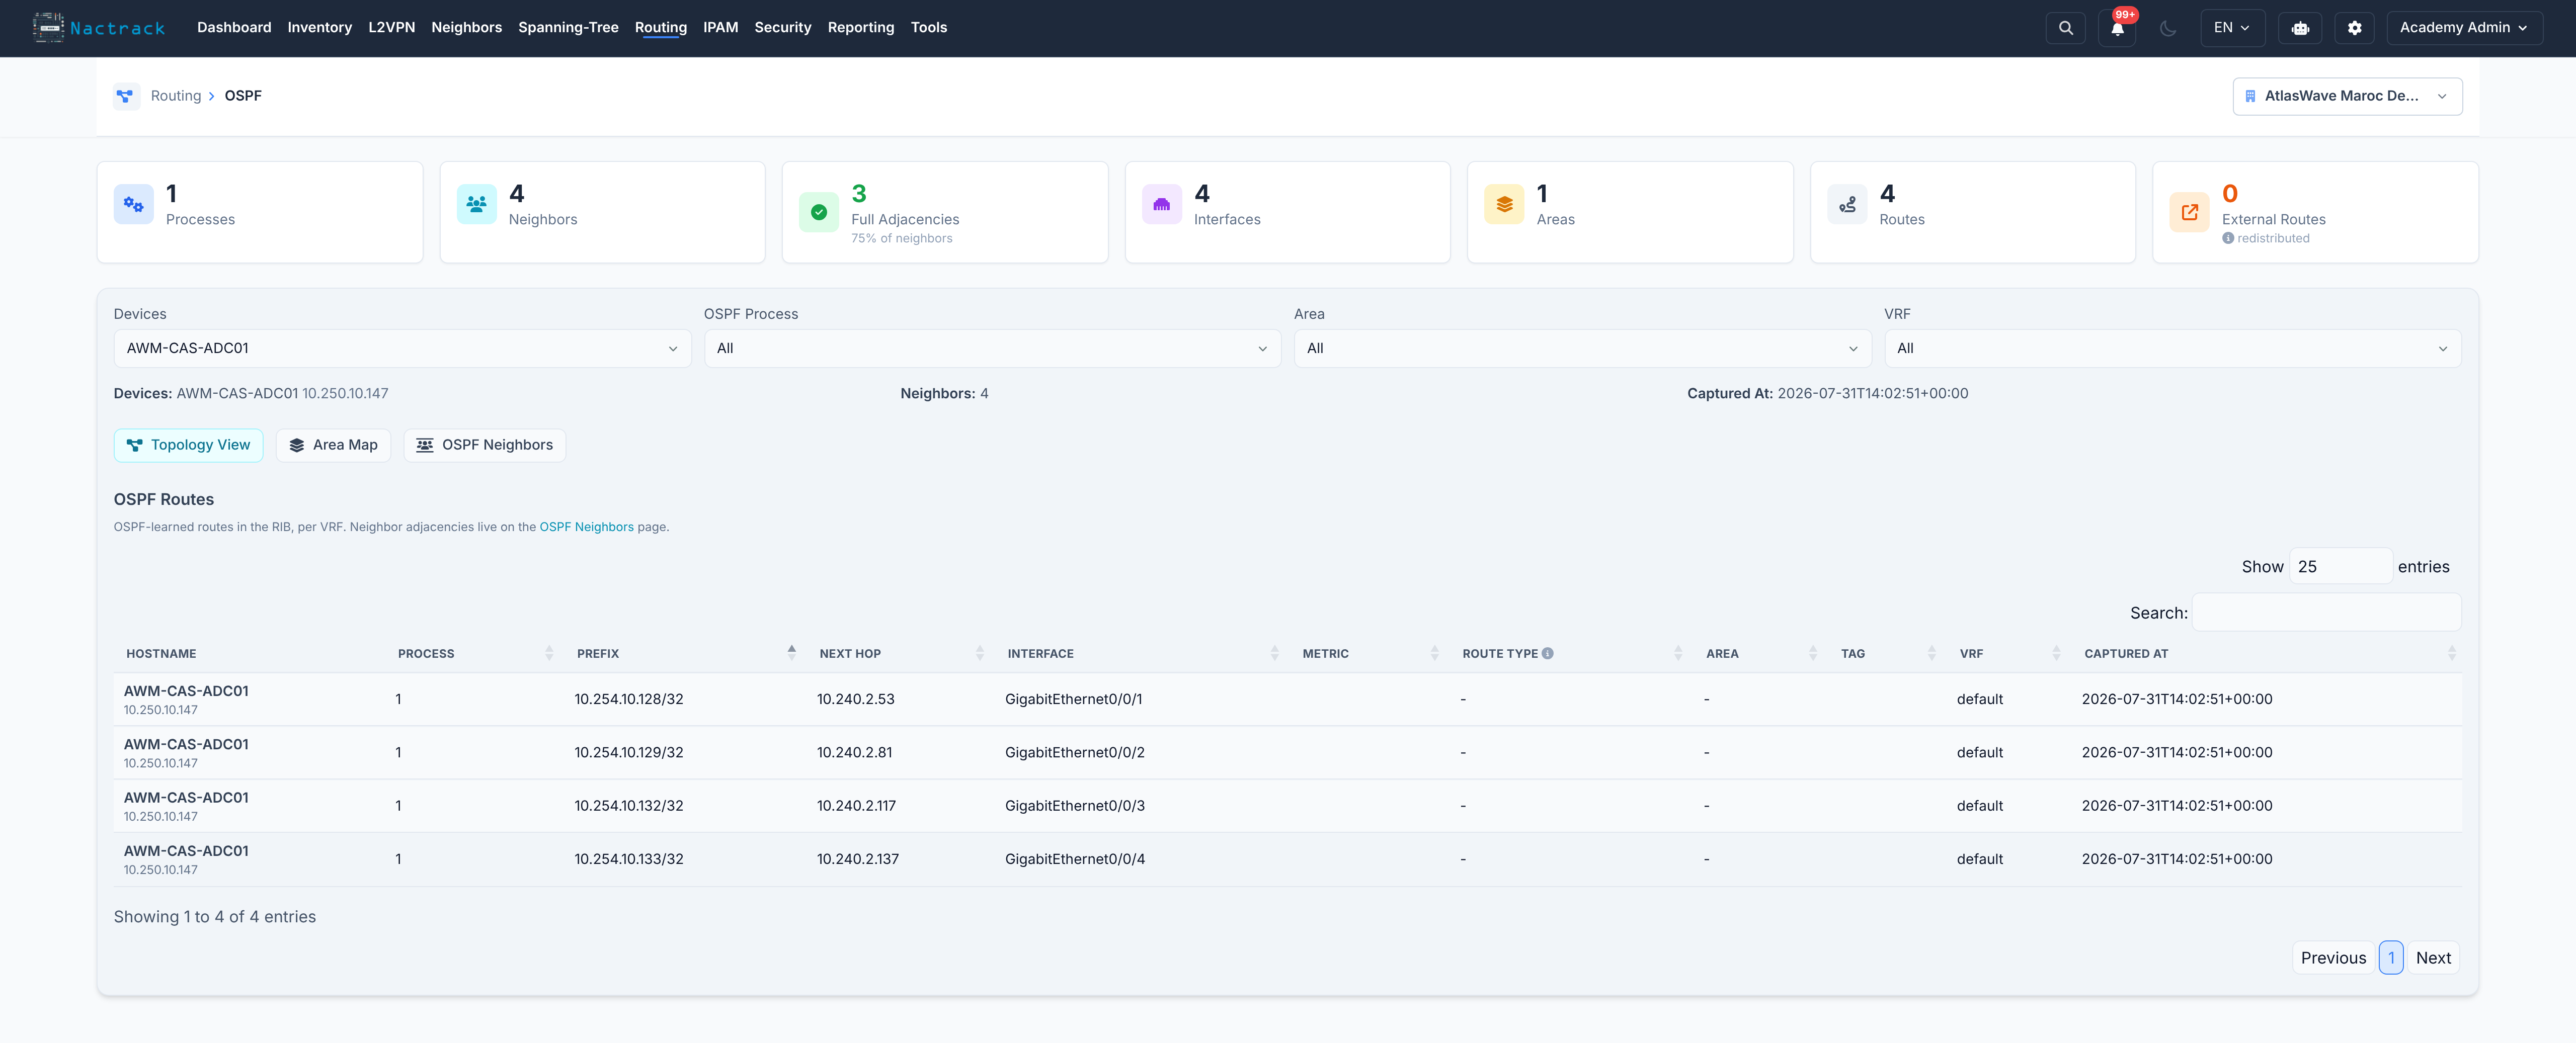
Analyze routing tables and protocols.
Route Tables
Navigate to Routing → Routes
View Options:- All Routes: Complete routing table
- ISIS Routes: Learned via ISIS
- BGP Routes: Learned via BGP
- Static Routes: Manually configured
- Connected Routes: Directly attached networks
- Destination: Network prefix
- Next Hop: Next router IP
- Interface: Outgoing interface
- Metric: Route preference
- Protocol: Source protocol
- Administrative Distance: Route priority
- Search by prefix
- Filter by protocol
- Filter by VRF
- Filter by next-hop
BGP Routes
Detailed BGP routing information:
- AS Path: Autonomous system path
- Local Preference: BGP preference value
- MED: Multi-exit discriminator
- Communities: BGP community tags
- Origin: IGP, EGP, Incomplete
Route Analytics
Analyze routing behavior:
- Route Stability: Track route flapping
- Prefix Counts: Per-protocol statistics
- Next-Hop Distribution: Load balancing analysis
- Route Changes: Compare snapshots to see routing changes
L2VPN & Transport Services
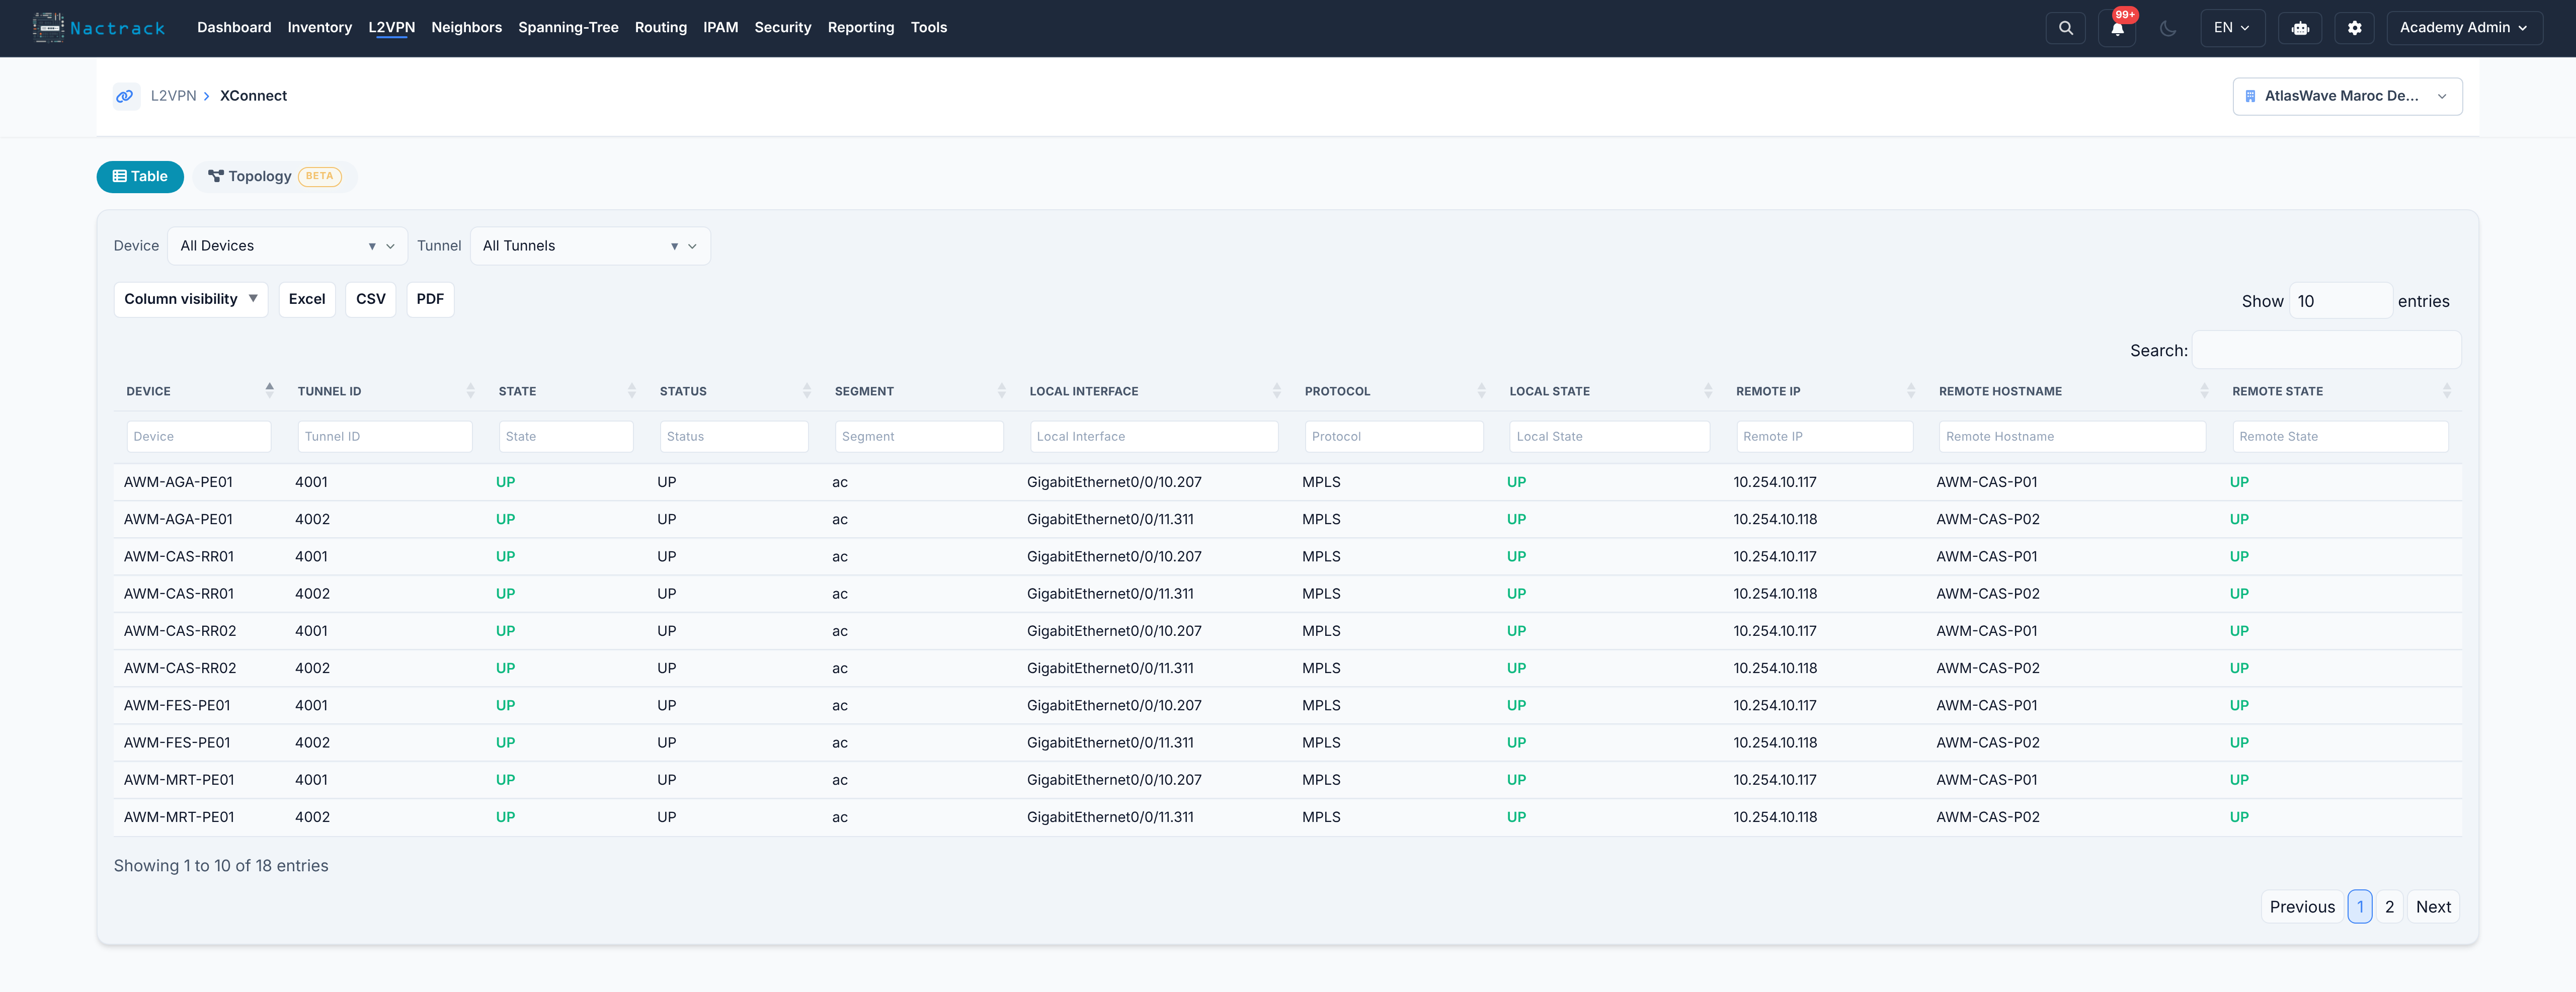
Manage Layer 2 VPN circuits and MPLS services.
L2VPN Overview
Navigate to Transport → L2VPN
View all Layer 2 VPN services:
- Service ID: Circuit identifier
- Type: XConnect, VPLS, Bridge Domain
- Local Endpoint: Your device interface
- Remote Endpoint: Peer device/interface
- VC ID: Virtual circuit ID
- Status: Up/Down
- Encapsulation: MPLS, VLAN, etc.
XConnect Circuits
Point-to-point L2VPN connections:
- Local Attachment Circuit: Customer-facing interface
- Peer IP: Remote PE router
- VC ID: Circuit identifier
- MTU: Maximum transmission unit
- Control Word: Enabled/disabled
- Status: Operational state
- Visual graph of all XConnect circuits
- Filter by status or endpoint
- Identify service paths
VPLS Services
Virtual Private LAN Service instances:
- VFI Name: VPLS forwarding instance
- Bridge Domain: Layer 2 domain
- Member Interfaces: Access circuits
- Pseudowires: MPLS tunnels to peers
- MAC Table Size: Learned MAC addresses
MPLS LDP Interfaces
View LDP-enabled interfaces:
- Interface Name: Physical or logical port
- LDP Status: Enabled/disabled
- LDP Neighbors: Count of LDP peers
- Label Space: Label allocation range
Transport Topology
Visualize MPLS transport network:
- P2P Topology: Point-to-point services
- Full Mesh View: All VPLS peering
- LDP Topology: Label distribution graph
- Click circuit to see details
- Filter by service type
- Highlight path for specific VC ID
Troubleshooting Tools
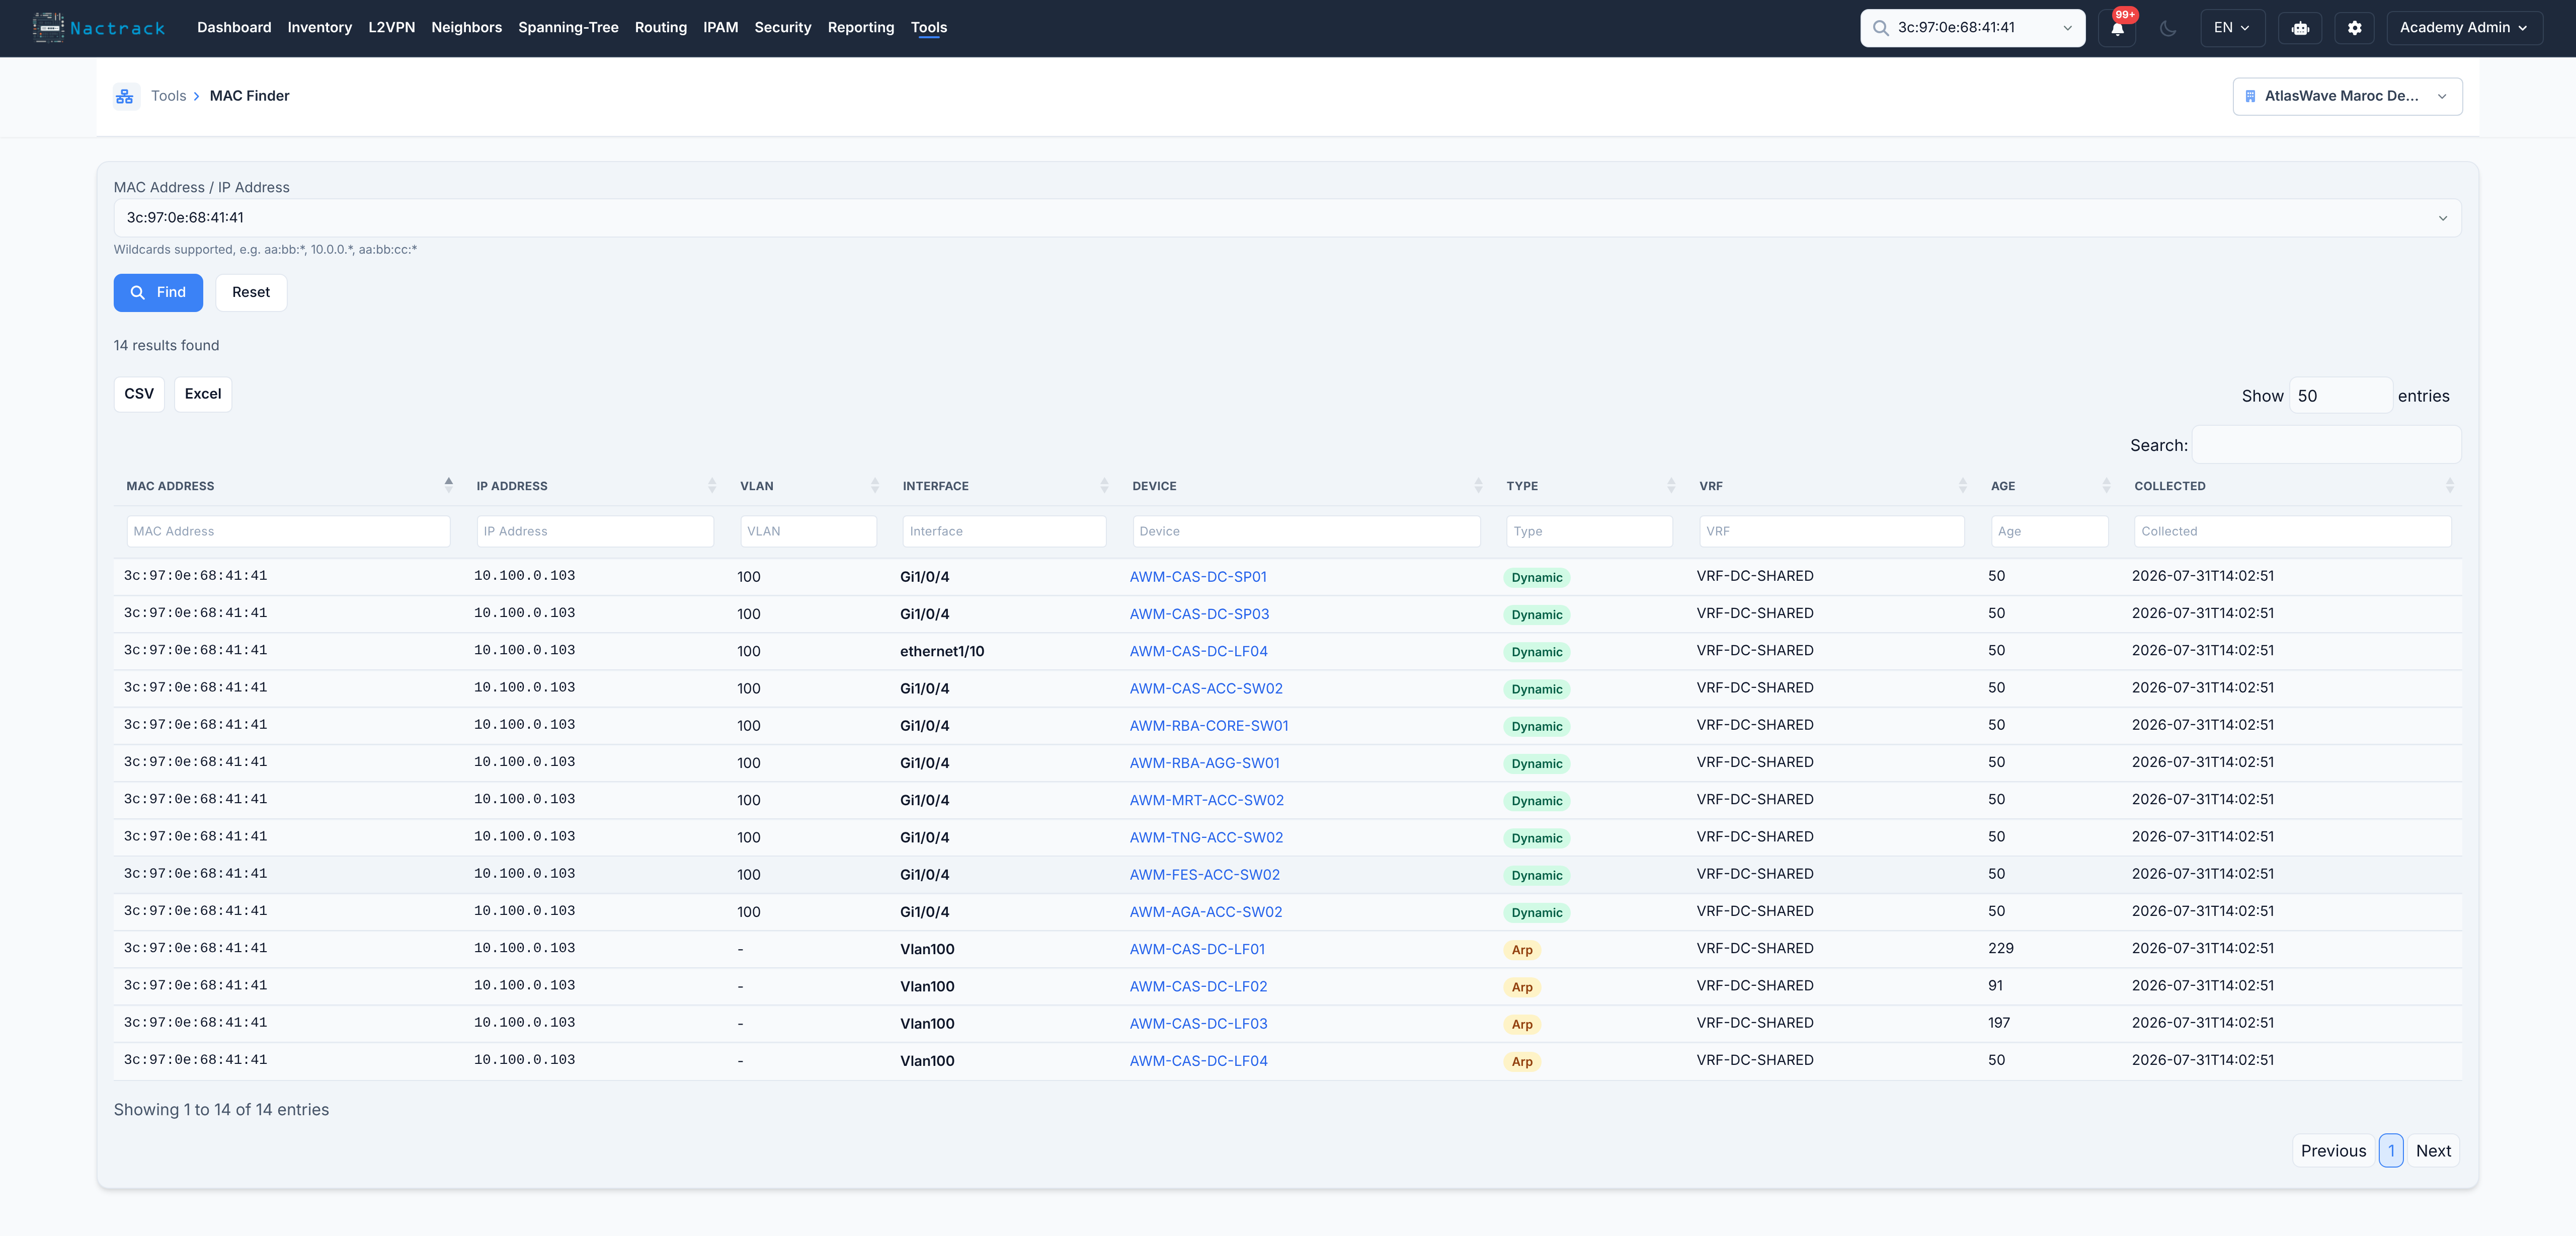
Built-in network diagnostic utilities.
IP Finder
Quickly locate where an IP address is used:
- Navigate to Troubleshooting → IP Finder
- Enter IP address (e.g., 192.168.1.100)
- View results:
- Device: Which device uses this IP
- Interface: Specific interface assignment
- VLAN: Associated VLAN
- VRF: Routing instance
- MAC Address: Hardware address (if available)
- ARP/CAM: Switch port location (if device is host)
Use Cases:- Troubleshoot IP conflicts
- Find where a server is connected
- Verify DHCP assignments
- Locate network endpoints
Traceroute
Perform network path tracing:
- Navigate to Troubleshooting → Traceroute
- Select Source Device (starting point)
- Enter Destination IP
- Click Start Traceroute
- View real-time progress:
- Hop-by-hop path display
- Latency for each hop
- Device names (if in inventory)
- Interface information
Traceroute Features:- Live Updates: See hops as they're discovered
- Path Visualization: Graphical route display
- Export Results: Download trace for documentation
- Compare Traces: Side-by-side path comparison
- Identify routing loops
- Find asymmetric paths
- Locate packet loss points
- Verify traffic engineering
Device Search
Find devices by various criteria:
- Hostname: Partial or full name
- IP Address: Management or interface IP
- Serial Number: Hardware serial
- MAC Address: Find by MAC
- Model: Specific hardware type
- Location: Physical site
Interface Search
Locate interfaces across all devices:
- Interface Name: e.g., GigabitEthernet0/1
- Description: Search port descriptions
- IP Address: Interface IP
- VLAN: Assigned VLAN
- Status: Up/down state
Compliance & Auditing
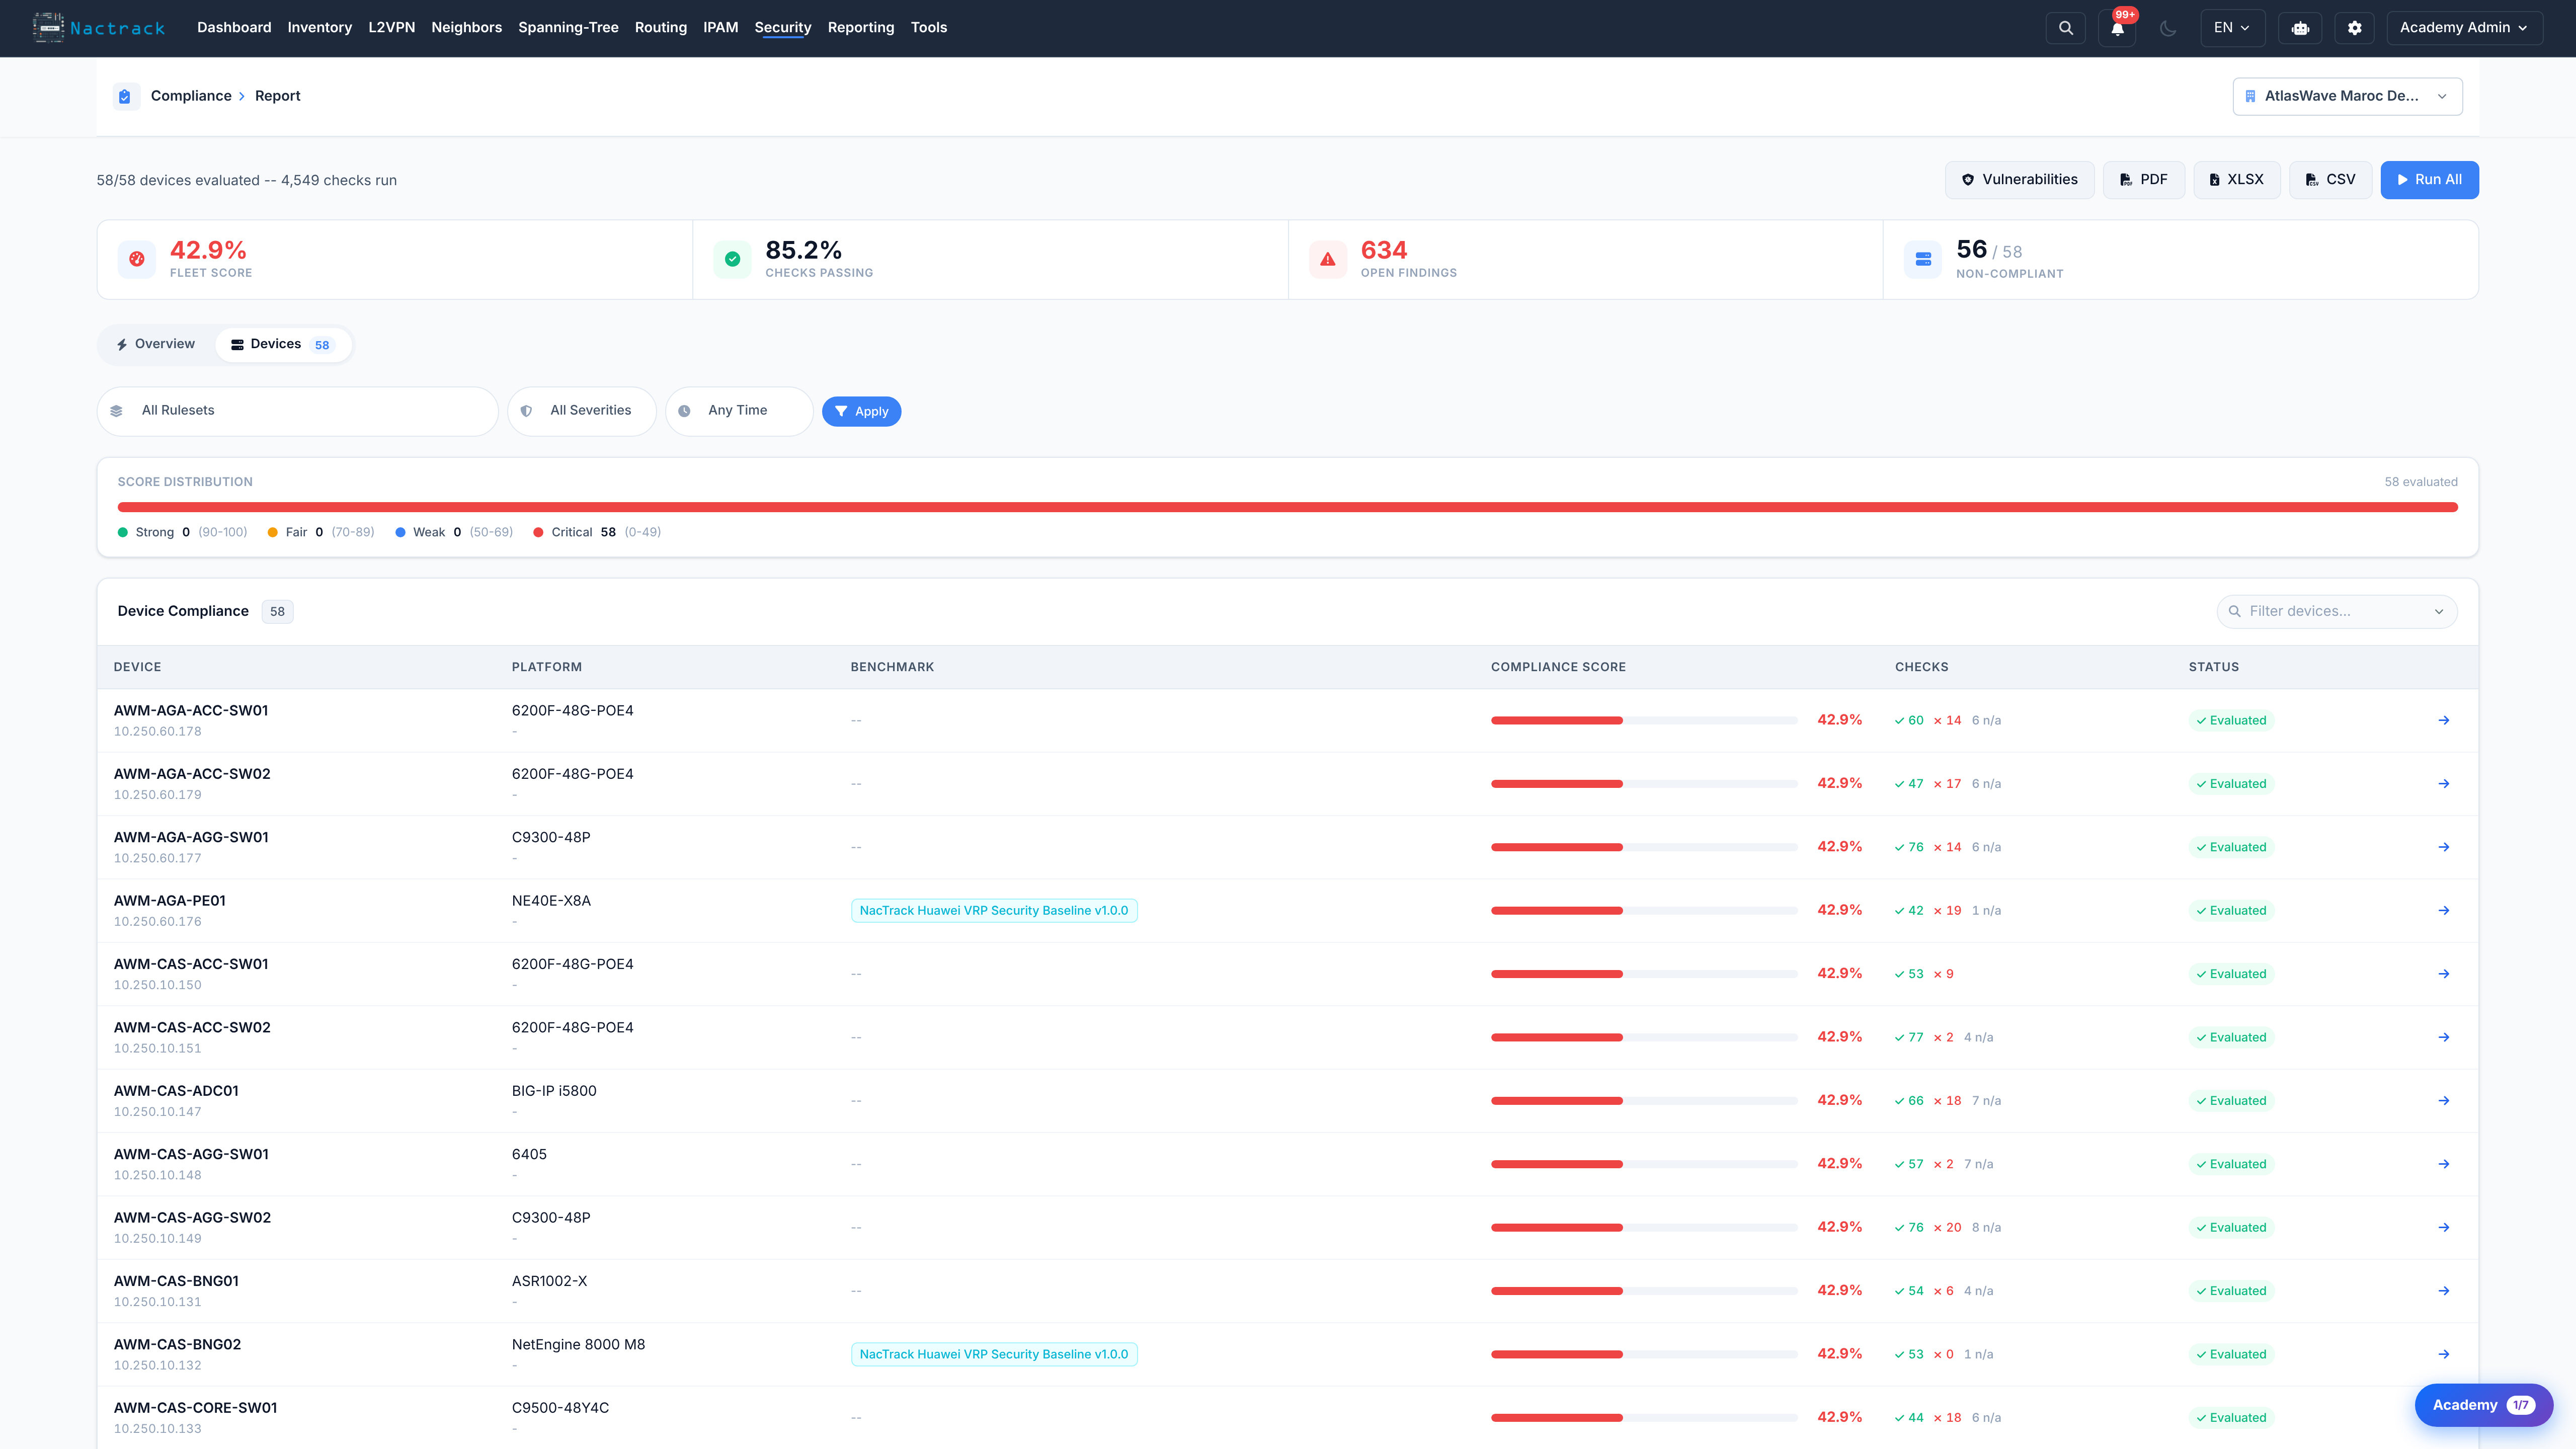
Ensure network configurations meet organizational standards.
Compliance Dashboard
Navigate to Compliance → Dashboard
Overview Metrics:- Overall Compliance Score: Percentage across all devices
- Compliant Devices: Count of passing devices
- Non-Compliant Devices: Devices failing policies
- Critical Violations: High-severity issues
Running Compliance Audits
Execute compliance evaluations:
- Navigate to Compliance → Run Audit
- Select Devices (all or specific subset)
- Select Policy Set (if multiple available)
- Click Run Evaluation
- Wait for results (progress shown)
Viewing Compliance Results
After audit completion:
- Device List: Compliance score per device
- Violation Summary: Grouped by policy
- Severity Breakdown: Critical, High, Medium, Low
- Trend Analysis: Compliance over time
Device Compliance Details
Click on a device to see:
- Passed Checks: Which policies device meets
- Failed Checks: Violations with details
- Remediation Guidance: How to fix issues
- Configuration Context: Relevant config lines
Compliance Policies
Understand what's being checked:
- Access Control Lists: ACL standards
- Service Hardening: Disabled unnecessary services
- Authentication: Strong authentication enforcement
- Logging: Proper logging configuration
- SNMP Security: SNMPv3 usage
- Management Plane: Secure management access
- Interface Standards: Port configuration requirements
Remediation Workflow
For non-compliant devices:
- Review violation details
- Generate remediation config
- Schedule maintenance window
- Apply configuration changes
- Re-run compliance audit
- Verify compliance restored
Compliance Reporting
Generate compliance reports:
- Executive Summary: High-level compliance posture
- Detailed Audit Report: All findings with evidence
- Trend Report: Compliance changes over time
- Exception Report: Documented policy exceptions
Vulnerabilities & CVE Exposure
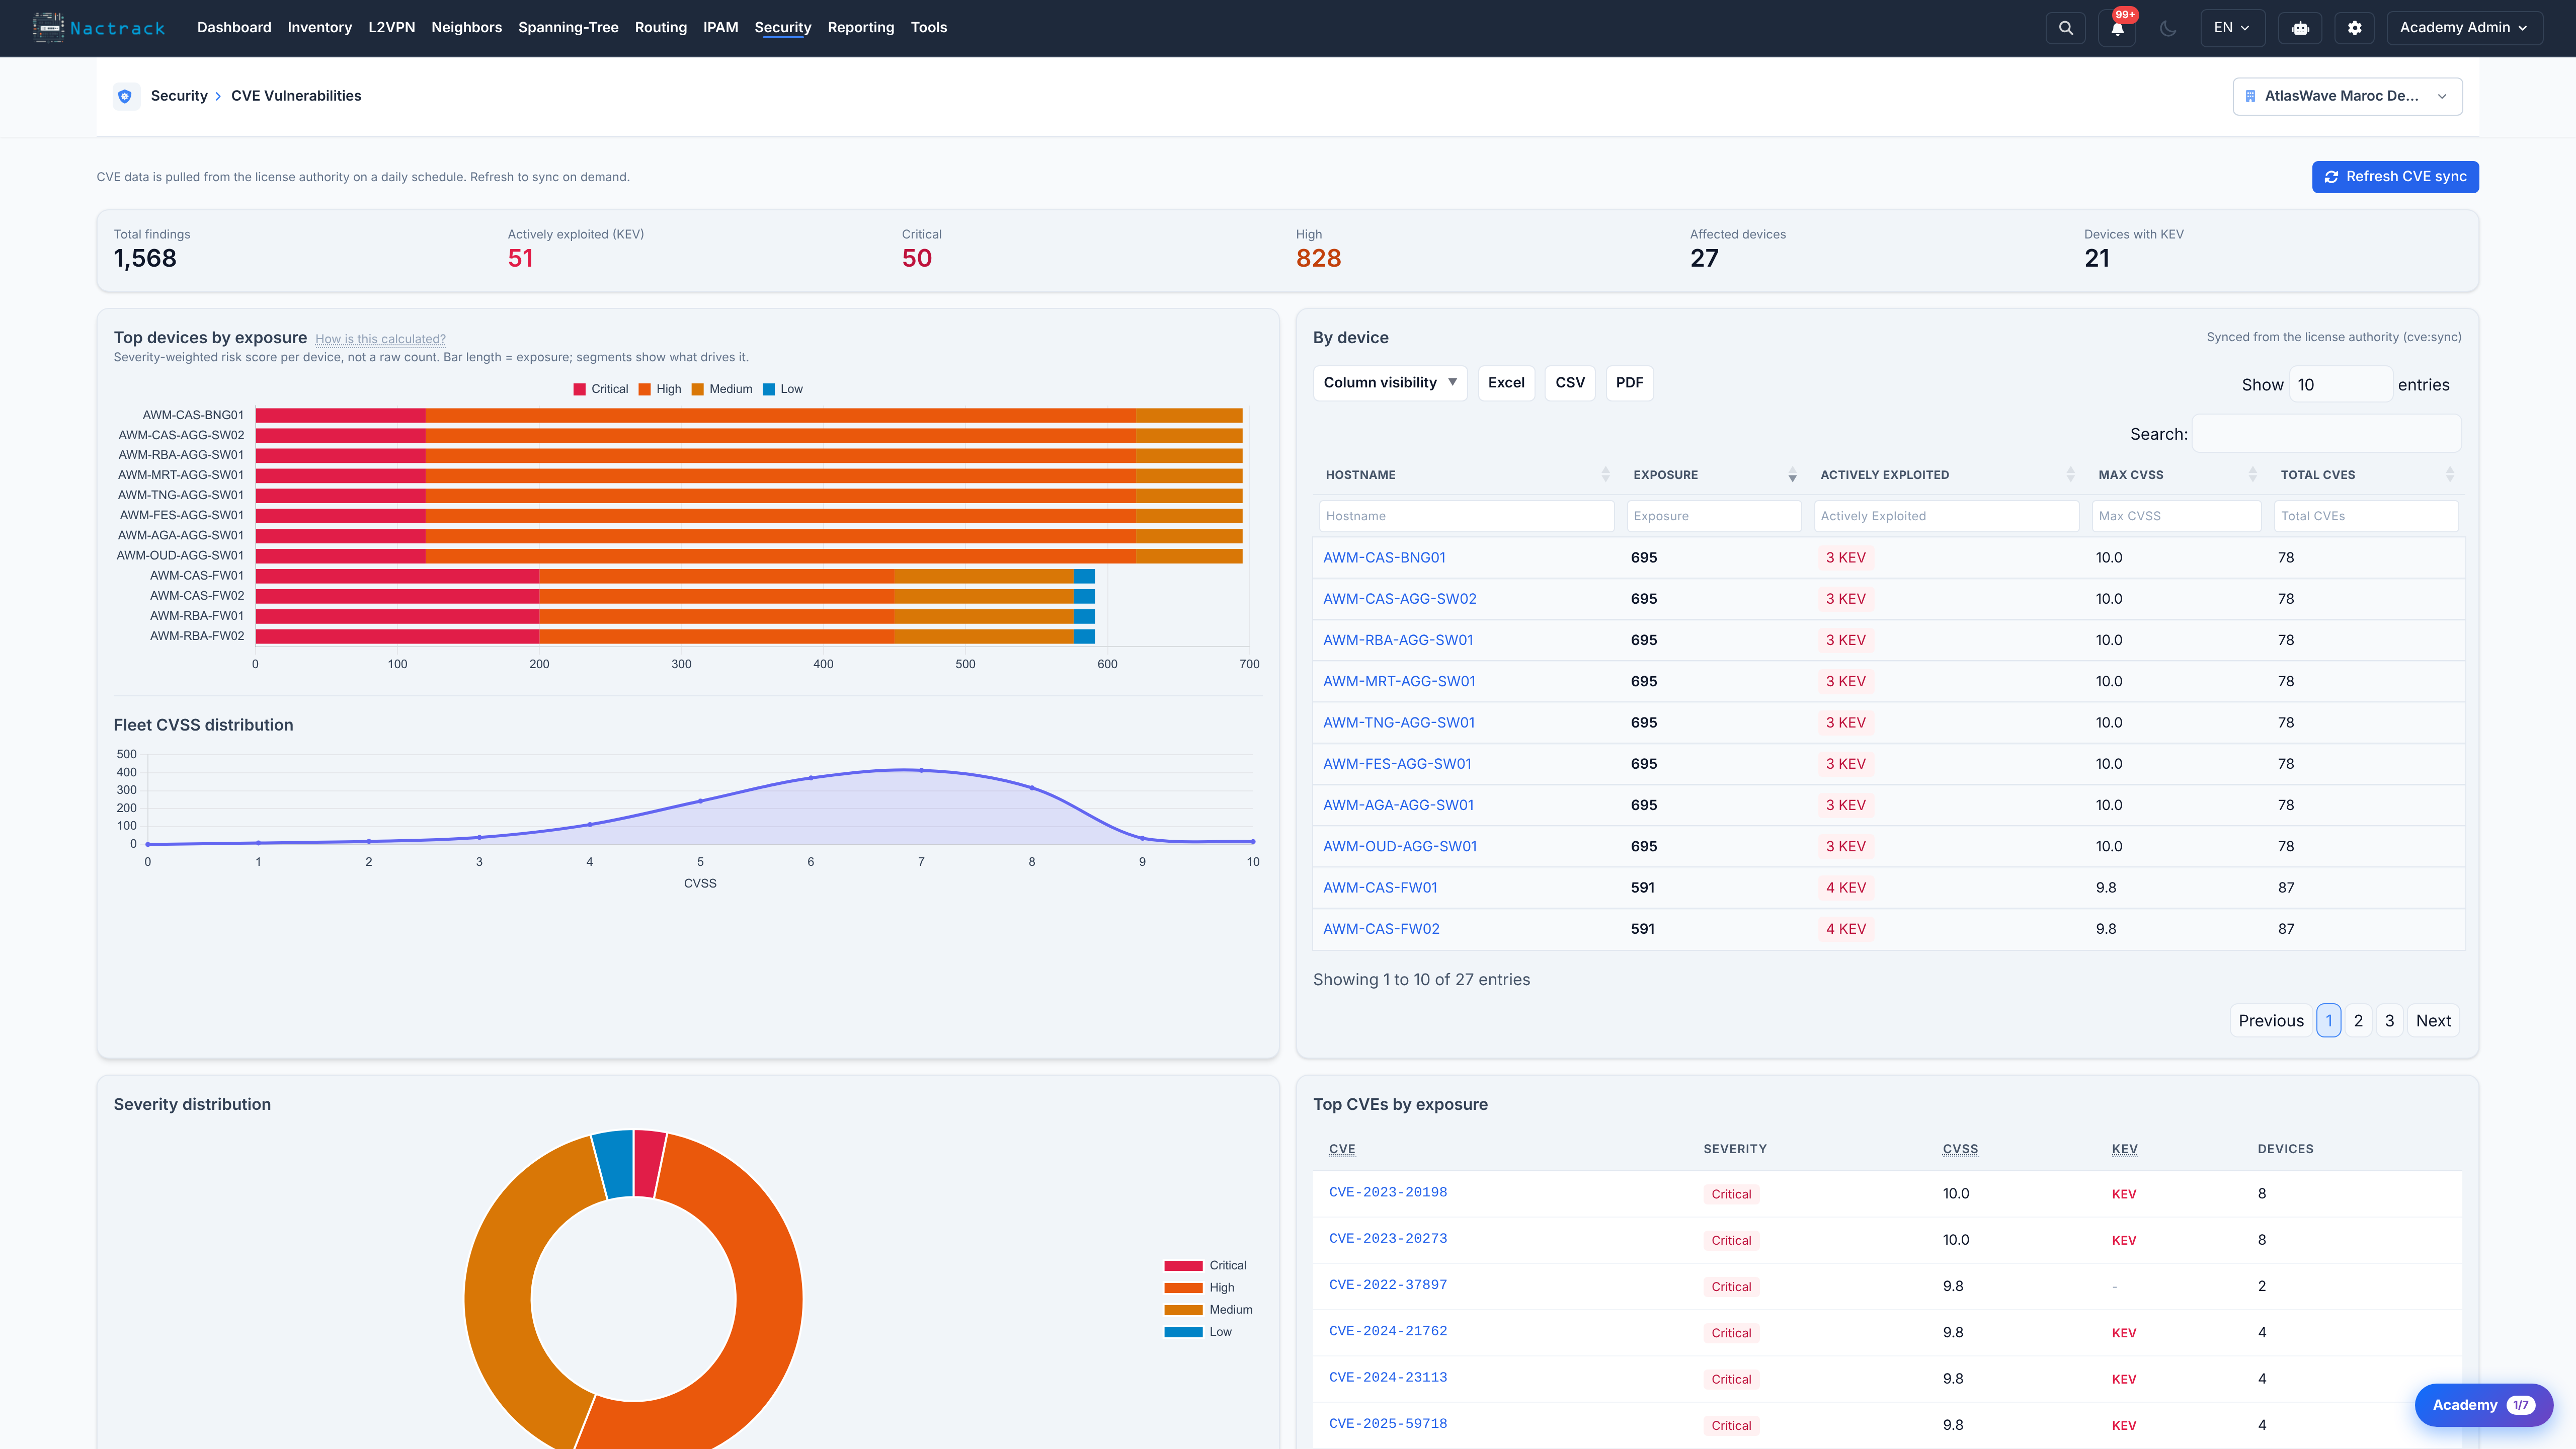
NacTrack cross-references each device's software version against known vulnerabilities so you can see your exposure at a glance.
Viewing CVE exposure
Navigate to Security → Vulnerabilities, or open the CVE exposure card on the dashboard.
- Sources: Cisco PSIRT for Cisco NOS; NVD / CPE for other vendors.
- Enrichment: KEV (Known Exploited Vulnerabilities) and EPSS (exploit-probability score).
- Per device: matched CVEs, CVSS score, KEV flag and the first fixed-in version.
Working with findings
- Filter by severity or KEV to focus on what matters.
- Click a CVE to open its detail (linked to the NVD entry).
- Export the list to Excel / CSV for remediation planning.
Syncing CVE data
CVE data refreshes on a nightly schedule. To refresh on demand, use Security → Sync CVEs. Findings are version-based; confirm against the device configuration before remediation.
Lifecycle & End-of-Life (EOL / EOS)
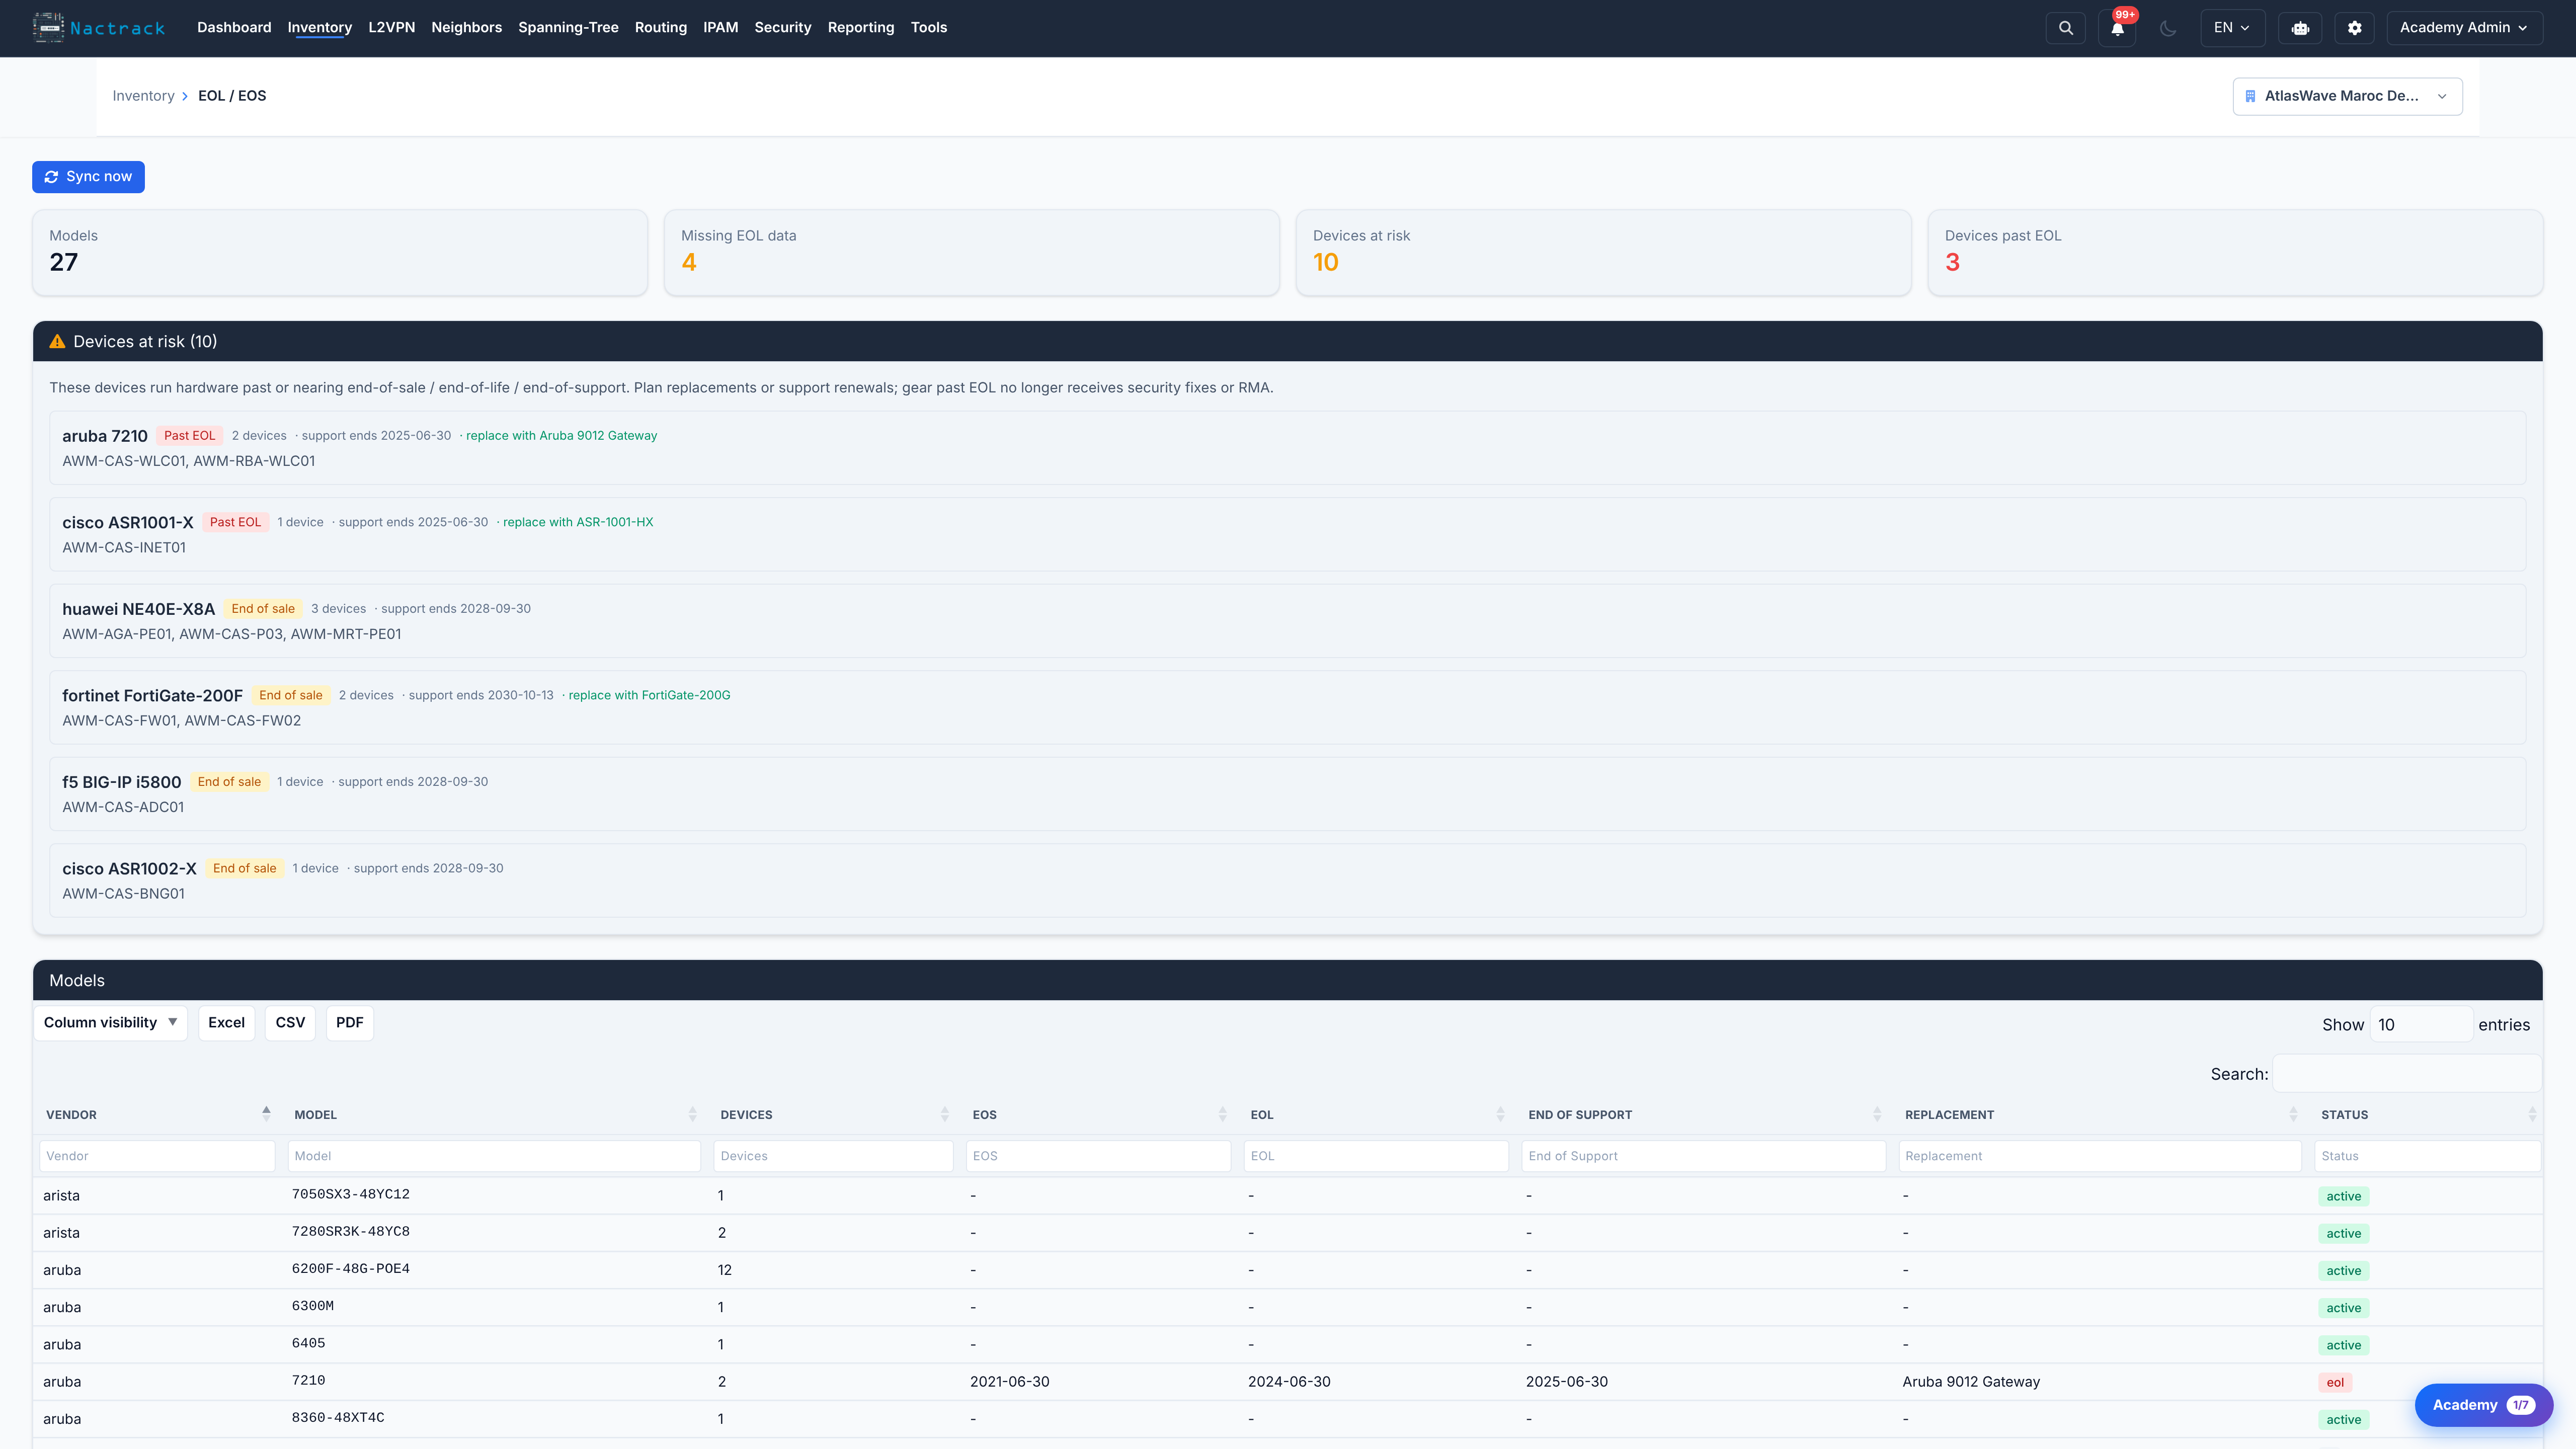
Track hardware and software approaching end-of-life or end-of-support so refreshes never take you by surprise.
Viewing lifecycle status
Navigate to Lifecycle → End-of-Life.
- Per device: end-of-sale, end-of-software-maintenance and last-support dates.
- Status: active, approaching EoS, or past EoL.
- Dashboard card: devices reaching end-of-life within 90 / 180 / 365 days.
Export the list to support hardware-refresh and budget planning.
Security Benchmarks (CIS / STIG)
Beyond your own policies, NacTrack ships audit-grade hardening baselines derived from public-domain DISA STIG / CIS guidance, curated per platform.
Running a benchmark
- Navigate to Compliance → Benchmarks.
- Select a platform baseline and a device set.
- Click Evaluate.
Results show pass / fail / warning per check with remediation guidance and a compliance trend over time, alongside your custom policy audits.
Configuration Management
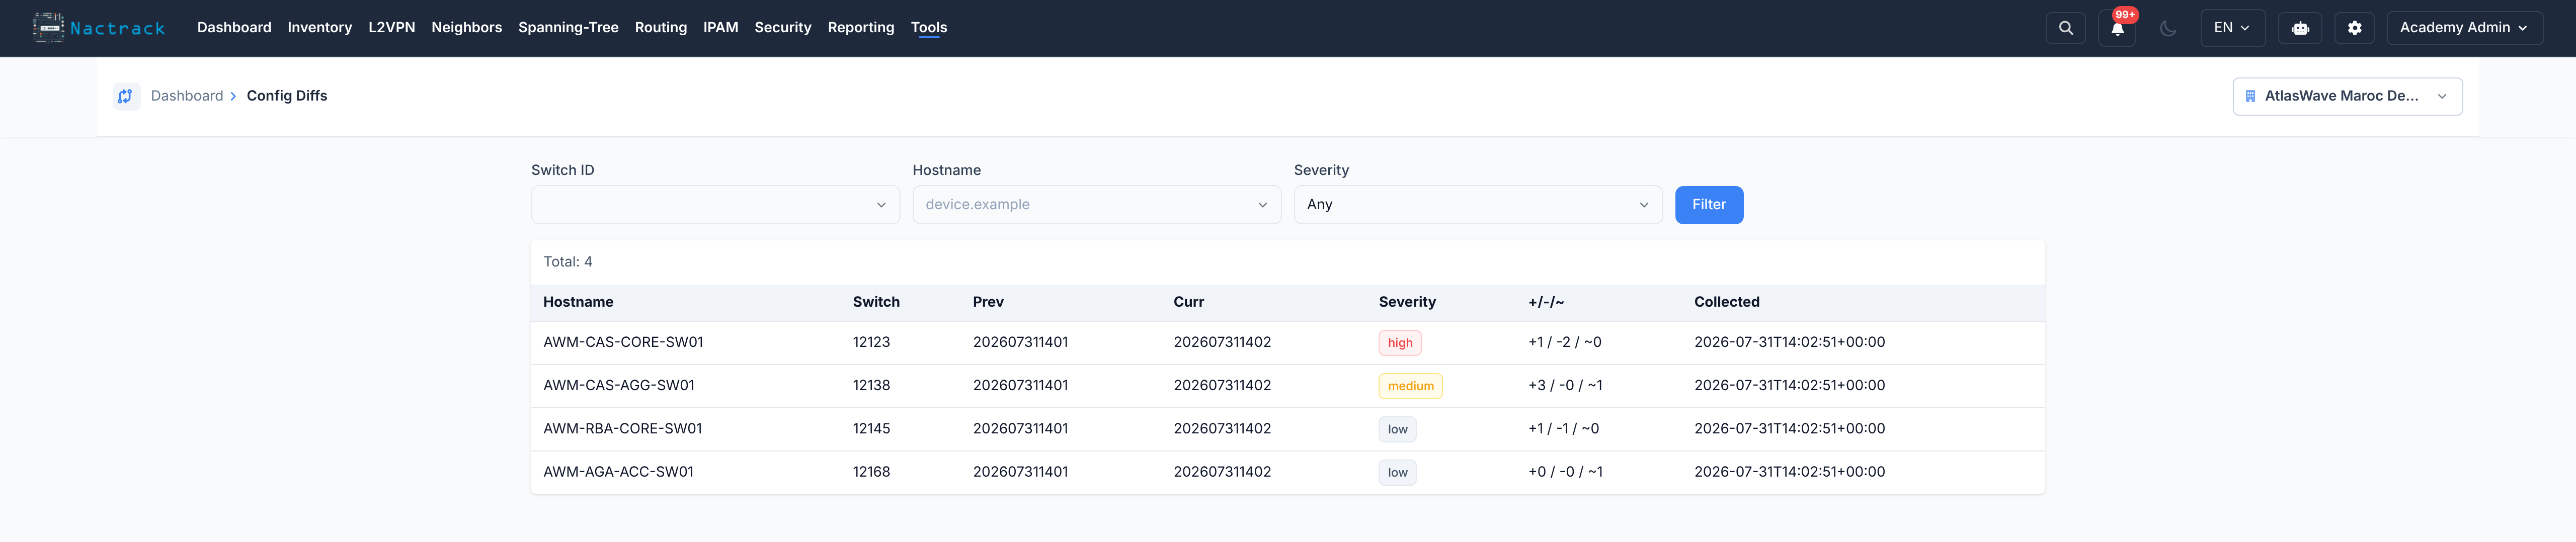
NacTrack keeps a history of every device configuration and lets you see exactly what changed.
Snapshots
A configuration snapshot is stored on each collection. Navigate to Devices → select a device → Config to browse snapshots.
Configuration diff
Select any two snapshots to see a line-by-line diff - added, removed and changed lines - with the timestamp of the change.
Importing configurations
Use Configuration → Import to load device configs, show-tech or session logs directly. Vendor backups are recognized, including PAN-OS XML and FortiGate configuration files.
Route Trace & Path Analysis
Trace the path traffic takes between two points - hop by hop - reconstructed from the collected routing state, without touching the live network.
Running a trace
- Navigate to Topology → Route Trace.
- Enter a source and destination (device or IP).
- NacTrack computes the path across the topology.
Each hop is classified - connected, static, OSPF, iBGP or eBGP - with per-VRF awareness. Route Trace answers "why can't A reach B?" and supports blast-radius analysis.
BGP EVPN / VXLAN
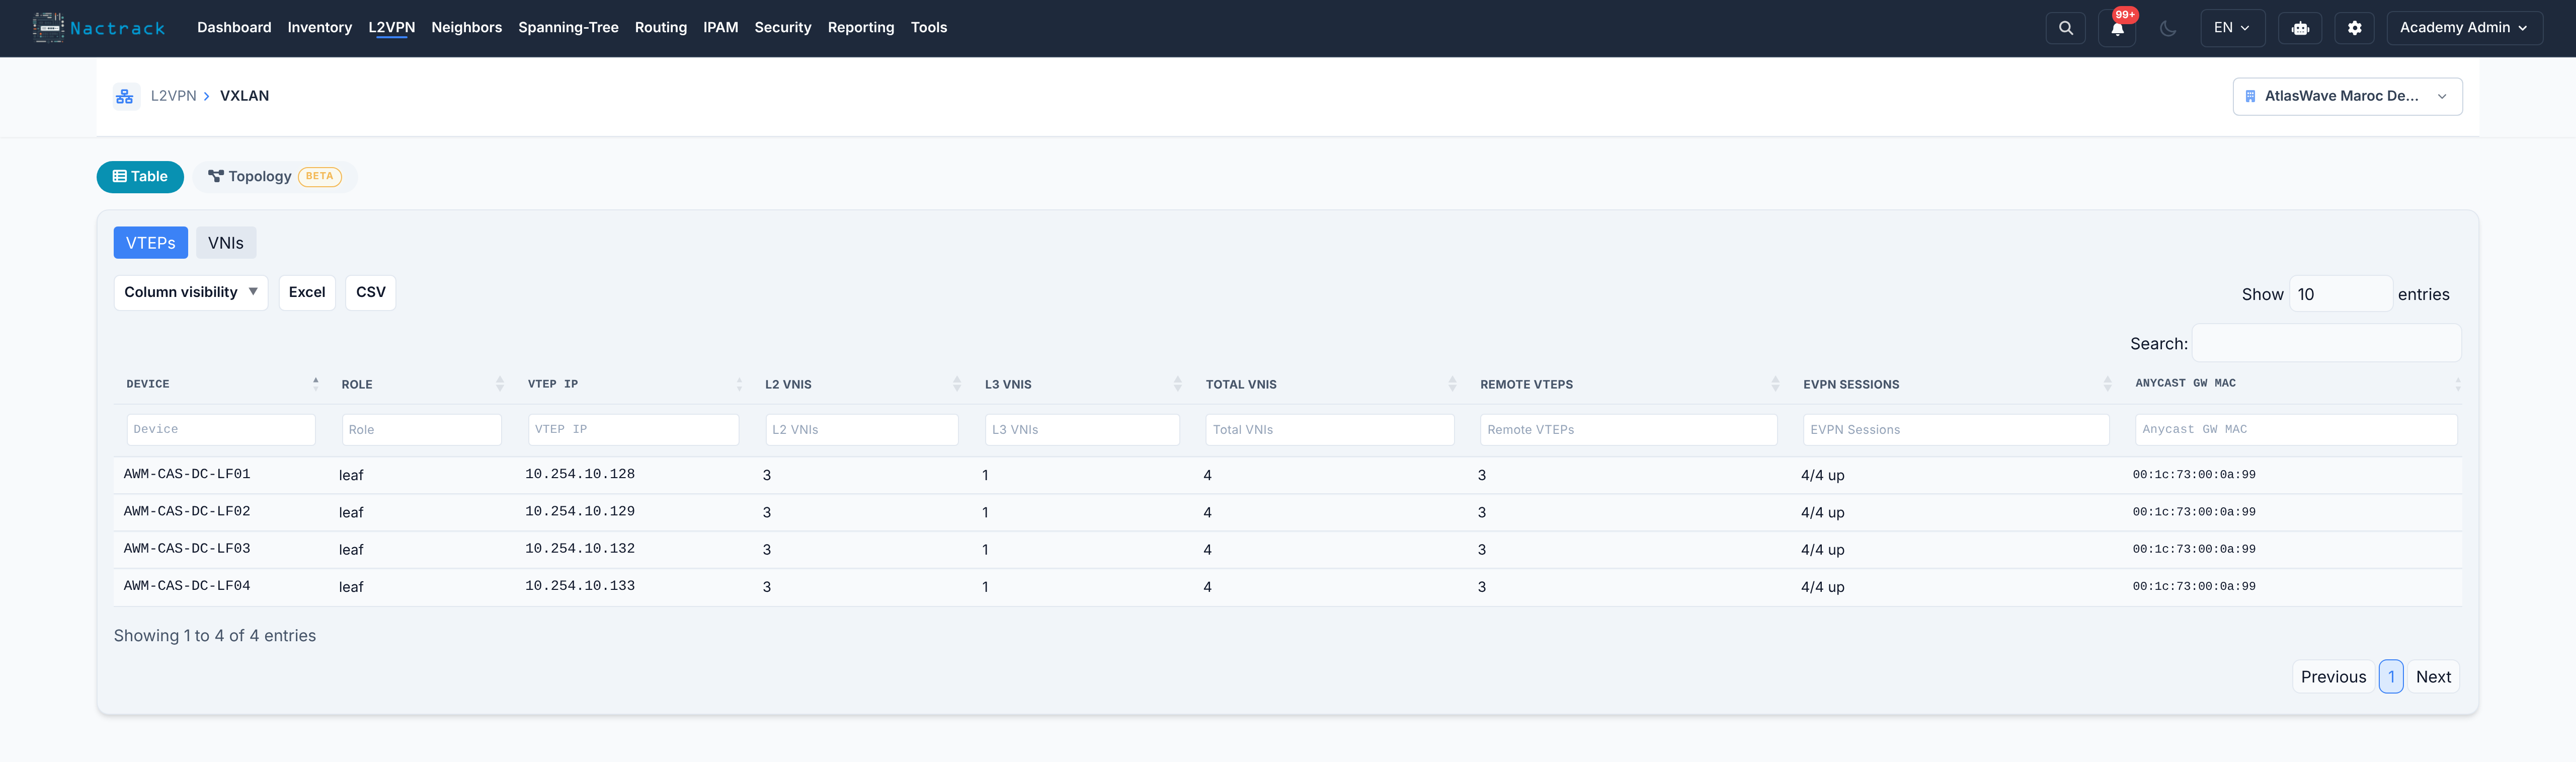
For data-center fabrics, NacTrack collects and visualizes the overlay transport layer.
Viewing the fabric
Navigate to Topology → EVPN / VXLAN.
- VTEPs and VNIs across the fabric.
- EVPN peers and the overlay-to-underlay relationship.
- Supported on Cisco NX-OS, Dell OS10 and other EVPN platforms.
On-Demand Support Tunnel
When you need assistance from Yuften, open a secure remote-support tunnel - and only while you need it. There is no standing remote access.
Opening and closing the tunnel
On the appliance, from the CLI:
nactrack support-on- open the tunnel.nactrack support-status- check whether it is up.nactrack support-off- close it.
The tunnel is a WireGuard connection to the NacTrack license authority. The support team can reach your appliance only while the tunnel is open - you control when that is.
Support Tickets
Manage support requests integrated with Mantis ticketing system.
Viewing Support Tickets
Navigate to Support → Dashboard
Ticket List Columns:- Ticket ID: Unique identifier
- Summary: Brief description
- Status: New, Assigned, Resolved, Closed
- Priority: Low, Normal, High, Urgent, Immediate
- Category: Network, Hardware, Software, etc.
- Assigned To: Technician or team
- Created: Submission date
- Updated: Last activity
Creating Support Tickets
Submit a new support request:
- Navigate to Support → Create Ticket
- Fill out ticket form:
- Summary: Brief title
- Description: Detailed problem description
- Category: Select appropriate category
- Priority: Set urgency level
- Device: Optionally link to device
- Attachments: Upload screenshots, logs, configs
- Click Submit
- Provide clear, concise summary
- Include error messages verbatim
- Attach relevant screenshots
- Link related device if applicable
- Specify impact and urgency accurately
Managing Your Tickets
Ticket Actions:- View Details: See full ticket information
- Add Comment: Provide updates or questions
- Attach Files: Add additional documentation
- Update Status: Change ticket state
- Escalate: Raise priority if needed
Ticket Notifications
Stay informed about ticket updates:
- Email notifications on status changes
- Comment notifications
- Assignment notifications
- Resolution notifications
Ticket Filters
Find specific tickets:
- My Tickets: Tickets you created
- Assigned to Me: Tickets you're handling
- Open Tickets: All unresolved tickets
- Recently Updated: Latest activity
- By Category: Filter by issue type
- By Priority: Filter by urgency
- By Device: Tickets for specific device
Ticket Resolution
When a ticket is resolved:
- Review resolution details
- Test the fix
- Close Ticket if satisfied
- Reopen Ticket if issue persists
Reports & Exports
Generate operational reports and export data.
Report Types
Navigate to Reports → Generate
Available Reports:- Device Inventory Report: Complete device list with specs
- Port Utilization Report: Interface usage statistics
- IP Address Report: IPAM allocation summary
- Compliance Report: Policy adherence details
- Topology Report: Network connectivity matrix
- Change Report: Configuration changes over time
- Availability Report: Device uptime statistics
Generating Reports
- Select Report Type
- Set Parameters:
- Date range
- Device filter (all or subset)
- Client/tenant (if multi-tenant)
- Output format (PDF, Excel, CSV)
- Click Generate Report
- Download when ready
Scheduled Reports
Set up automated report delivery:
- Navigate to Reports → Scheduled
- Click Create Schedule
- Configure:
- Report type
- Frequency (daily, weekly, monthly)
- Recipients (email addresses)
- Delivery time
- Parameters
- Save schedule
Reports will be emailed automatically.
Data Exports
Export data for external analysis:
Export Formats:- Excel (.xlsx): Rich formatting, multiple sheets
- CSV (.csv): Plain text, easy import
- JSON (.json): Structured data for APIs
- PDF (.pdf): Formatted documents
- Device inventory
- Interface/port lists
- IP address assignments
- Neighbor relationships
- Routing tables
- L2VPN circuits
- Compliance results
- Support tickets
- Navigate to desired data view
- Click Export button
- Select format
- Download file
Multi-Tenant Access
For multi-tenant deployments (MSPs, large enterprises).
Understanding Tenants
Tenants (also called "Clients") provide data isolation:
- Each tenant has separate device inventory
- Users can be assigned to multiple tenants
- Data is automatically filtered by current tenant
- Switch between tenants without re-login
Switching Tenants
If you have access to multiple tenants:
- Click User Menu (top right)
- Select Switch Client
- Choose desired tenant
- Click Switch
The entire interface will update to show only that tenant's data.
Current Tenant Indicator
Your active tenant is displayed:
- In the top navigation bar
- In the user menu
- On reports and exports
Always verify you're in the correct tenant before making changes.
Tenant-Specific Permissions
Your permissions may vary by tenant:
- Full admin in one tenant
- Read-only in another tenant
- Specific module access per tenant
Check with your administrator if you need different access.
Frequently Asked Questions
How often is device data collected?
Default collection interval is configurable (typically every 4-24 hours). Administrators can trigger manual collections anytime.
Can I download device configurations?
Yes, from the device detail page, go to the Configuration tab and click Download.
What browsers are supported?
NacTrack works best with modern browsers:
- Chrome/Edge (recommended)
- Firefox
- Safari
How do I report a bug?
Navigate to Support → Create Ticket and select the "Software Bug" category.
Can I customize dashboards?
Custom dashboards are available in the Admin settings (requires admin permission).
What if a device won't collect?
Check:
- Device is reachable from NacTrack server
- SSH credentials are correct
- Device has available resources
- Firewall rules allow SSH access
Contact support if issues persist.
Getting Help
In-App Help
Look for the ? icon throughout the interface for context-sensitive help.
Documentation
Full documentation available at: /docs/ directory or admin-configured help URL
Support Tickets
Create a support ticket for:
- Technical issues
- Feature requests
- Usage questions
- Bug reports
Administrator Contact
Reach out to your NacTrack administrator for:
- Access requests
- Permission changes
- New device additions
- Configuration assistance
Glossary
AS (Autonomous System): A collection of IP networks under a single administrative domain BGP (Border Gateway Protocol): Routing protocol for internet/WAN connectivity BRAS (Broadband Remote Access Server): Device managing subscriber access CDP (Cisco Discovery Protocol): Cisco proprietary neighbor discovery CIDR (Classless Inter-Domain Routing): IP address notation (e.g., 10.0.0.0/24) ISIS (Intermediate System to Intermediate System): Link-state routing protocol IPAM (IP Address Management): System for tracking IP allocations L2VPN (Layer 2 VPN): Virtual private network operating at data link layer LDP (Label Distribution Protocol): MPLS label exchange protocol LLDP (Link Layer Discovery Protocol): Vendor-neutral neighbor discovery MPLS (Multi-Protocol Label Switching): High-performance packet forwarding STP (Spanning Tree Protocol): Loop prevention for switched networks VC (Virtual Circuit): L2VPN connection identifier VRF (Virtual Routing and Forwarding): Network virtualization technique VPLS (Virtual Private LAN Service): Multipoint L2VPN service XConnect: Point-to-point L2VPN service*End of guide*
For administrative tasks, see the NacTrack Administrator Guide.